 Research Article
Abstract
Cation exchange capacity (CEC) is the total capacity of a soil to hold exchangeable cations. It influences the soil’s ability to hold onto essential nutrients and provides a buffer against soil acidification. Organic matter has a very high CEC. Anyhow potassium buffer power is known to be weak in other than clayey and silt soils, especially in peat, why fertilization can cause excessive variation in plant mineral composition. Finnish soil samples are collected mainly in autumns. That’s why they obviously reflect K buffer power of organic soils, too. The aim of this study is to clarify regional associations of cropland K, (estimate) CEC (Ca+Mg+K) and pH, in organic (org) and mineral soils (min), groundwater (gw) silicon (Si) and geographic factors Latitude (Lat) and Longitude (Long). The data are from old sources.
Results: Mean regional (CEC.org/CEC.min) ratio [CEC. (org/min)] was 1.28, mean K.(org/min) inversely 0.63 and pH. (org/min) 0.91. K.org was stronger explained by CEC. min (91.8 %), by Si.gw (71.0 %) and by [Lat; Long] (67.4 %) than by CEC.org (63.6 %), by pH.org (56.9 %) or by pH. min (43.0 %). Associations between single parameters were significant and positive. Si.gw explained better K.org than K.min and pH.org stronger than pH.min. Si.gw explained positively K.(org/min) (55.7 %, p = 0.001) and negatively CEC. (org/min) (32.0 %, p = 0.018).
Conclusion: In continental Finland regional Si.gw – obviously associated with weathering rate - explained significantly variation in K.org, K.min, K buffer, CEC.org, CEC.min, pH.org, pH.min, K.(org/min) and CEC. (org/min). Association of Si.gw with soil inorganic carbon is discussed.
Keywords:K buffer; CEC; Silicon; pH; Organic Soils; Mineral Soils; Groundwater; Geographic Factors
AbbreviationsSi: Silicon; Ca: Calcium; CEC: Cation Exchange Capacity; Min: Mineral Soils (e.g. CEC.min); CEC.(org/ min): CEC.org/CEC.min ratio; K: Potassium; K.(org/min): K.org/K.min ratio; Mg: Magnesium; pH.org/pH.min ratio: pH.(org/min); SD: Standard Deviation;
Introduction
Cation exchange capacity (CEC) is the total capacity of a soil to hold exchangeable cations [1]. The main ions associated with CEC in soils are the exchangeable cations calcium (Ca2+), magnesium (Mg2+), sodium (Na+) and potassium (K+) [2]. Because the number of other ions than Ca, Mg and K is small, the equivalent sum of (Ca+Mg+K) can be used as a practical estimate for CEC in Finland [3]. In general, organic matter increases CEC [1,4]. Anyhow in Finland potassium buffer power is known to be weak in other than clayey and silt soils, especially in peat, why fertilization can cause excessive variation in plant mineral composition [5]. Soil samples included in this study have been collected mainly in autumns [6]. So, the autumnal K values are thought to reflect the K buffer power of the regional soils. The aim of this study is to clarify regional associations of cropland K, (estimate) CEC (Ca+Mg+K) and pH from organic (org) and mineral (min) with each other and groundwater (gw) silicon (Si) as well as with combined geographic factors Latitude (Lat) and Longitude (Long).
Materials and Methods
Data on Si.gw are from Groundwater database © Geological Survey of Finland 2017 [7]. Soil values per Rural Centers (RC) - earlier ‘Agricultural Advisory Centers’ - from period 1986-90 are provided by Viljavuuspalvelu Eurofins Oy [8], as in [9]. Data on area of arable land (under cultivation) and borders of RC’s are from Official Statistics of Finland [10] as in [9] (N.B. in [9] Si est3 is erroneous).
Northern RC of Uusimaa ‘(01). Uudenmaan’ and its southern RC ‘(02). Nylands Svenska’ are combined to Uusimaa as in [11] responding together rather accurately combined Uusimaa of [12]. Administrative unit “Finska Hushållningss” RC providing arable land area in [10] includes (04a) ‘mainland Finska Hushållningss.’ RC with municipalities of Dragsfjärd, Houtskari, Iniö, Kemiö, Korppoo, Nauvo, Parainen, Västanfjärd [8] and separately all municipalities of (04b) RC Åland [8]. ‘(03). Administrative unit “Finska Hushållningss” RC in [10] includes (04a) ‘mainland Finska Hushållningss.’ RC with municipalities of Dragsfjärd, Houtskari, Iniö, Kemiö, Korppoo, Nauvo, Parainen, Västanfjärd [8] and separately all municipalities of (04b) RC Åland [8]. ‘(03). Varsinais-Suomen’ and RC ‘(04.a) mainland Finska Hushållningss.’ are combined to Varsinais-Suomi, which is a Finnish region as such, as in [11]. Values for (combined) Uusimaa and “combined” Varsinais-Suomi are attained by weighting parameter values with arable land areas. Values of Åland were excluded because of carbonate soil type (and poor Si.gw and CEC association) [9]. ‘(16). Österbottens Svenska’ (=Ostrobothnia) was excluded because of small number of samples (11) and exceptionally high Si.gw.mean/Si.gw.median ratio 1.62 (1.78/1.10) [7]: On an average this ratio in RC´s was 1.08 (+/- 0.14) [7]. In ‘Österbottens Svenska’ this ratio was ca 4 SD units higher. Geographic coordinates are determined by the data of their visually selected central communes as in (11).
After combinations and exclusions there are left 17 regions with 592,012 soil samples, including 488,461 samples from mineral soils and 103,551 from organic soils and 713 Si.gw samples (Table 1). Directions of geographic concentration vectors of K, Si.gw and CEC calculated by Lat and Long coefficients (C) of combined regressions and adjusting C. Long with cosine (0.463) of mean Latitude (62.4°, 1.09 r).
In calculations have been benefited program “IBM SPSS Statistics, Version 25”.
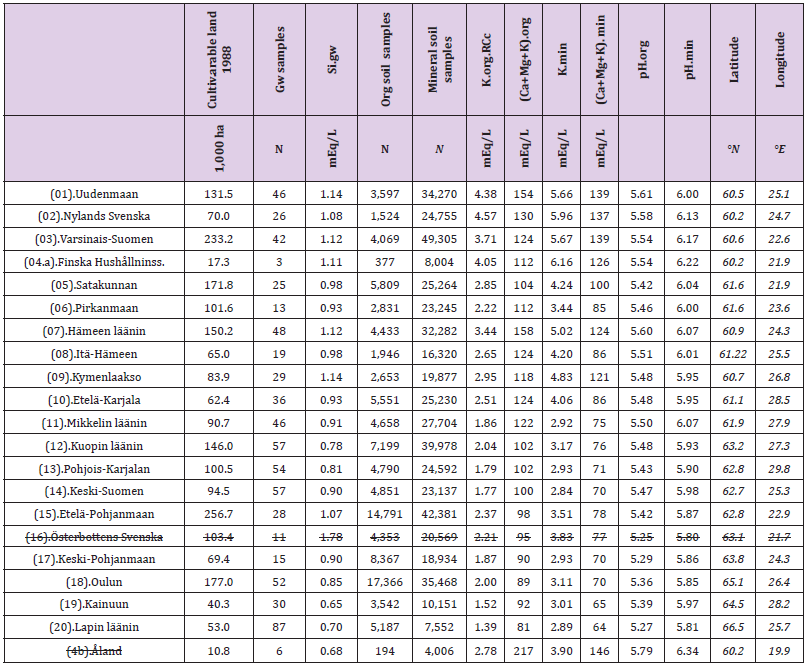
Table 1: Area of arable land under cultivation, Number of groundwater (gw) samples, Si.gw, Number of samples from organic and mineral soils, K, CEC (Ca+Mg+K), pH and Location (°N, °E of Centrum of central commune) of Rural Centers.
Results
CEC.org (110.9) was higher to CEC.min (89.3): CEC.org/CEC. min ratio [CEC. (org/min)] was 1.28. K.org (2.43) was (oppositely) lower to K.min (3.80): K.(org/min) was 0.63. Regional variation (SD/Mean (%)] was high in values of K.org, proportion of org soiltypes and number of gw samples: SD/Mean was more than 30 %. Variation was slightly lower in K.min and CEC.min (26 – 28 %), 16- 19 % in Si.gw and CEC.org. Variation was lowest and rather similar in pH.org and pH.coms (1.6 – 1.7 %), although variation in pH.org was slightly higher. Variation of Long was 3.2-fold to Lat (Table 2). Table 3 shows R squares of mutual regressions of Si.gw, K.org, CEC. org, K.min, CEC.min, pH.org, pH.min by each other and their (combined) regressions by [Lat; Long]. Significance levels for single associations are given in lower part of Table 2. All single regressions were significant (R2 (%) > 24.6). Significance levels of [Lat; Long] are not separately given but they were ≤ 0.002 (0.002 by pH.min).
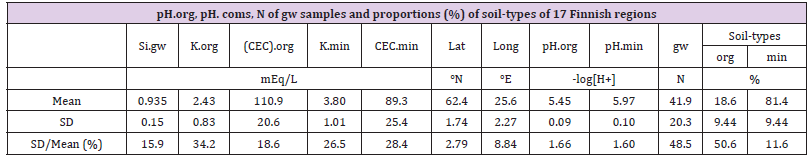
Table 2: Shows standard deviations and coefficients of variation (SD/Mean in percent’s) of the parameters.
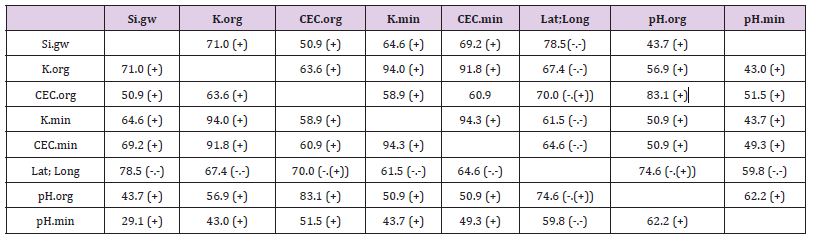
Table 3: R squares of mutual Regressions of Si.gw, K.org, CEC.org, K.coms, CEC.coms, pH.org, pH.coms by each other and by combined [Lat; Long]. Results are given two times to help comparing.
Significances of single regressions (df 16): R2 (%) > 24.6: p < 0.05, R2 (%) > 37.7: p < 0.01, R2 (%) > 52.4: p < 0.001
K.org was explained 94.0 % by K.min (Figure 1), 91.8 % by CEC. min, 71.0 % by Si.gw (Figure 2), 67.4 % by [Lat; Long] (Figure 3) and 63.6 % by CEC.org. K.min was explained 94.3 % by CEC.min, 94.0 % by K.org, 64.6 % by Si.gw explained stronger K.org than K.min and pH.org than pH.min, but weaker CEC.org than CEC.min. Both (org and min) K and CEC parameters explained stronger pH.org than pH.min. Si.gw was explained 78.5 % by [Lat; Long] (signs of regression coefficients were negative) (Figure 4). K.org/K. min ratio [K.(org/min)] was explained 55.7 % (p = 0.001) by Si.gw (Figure 5), 41.8 % (p = 0.005) by pH.org and 20.3 % (p = 0.070) by pH.min. All coefficients of [K.(org/min)] were positive. CEC. (org/ min) was explained 32.0 % (p = 0.018) by Si.gw (inversely) (Figure 6) and 38.2 % (p = 0.035) by [Lat; Long] (both coefficients were negative). Approximate directions of concentration vectors of Si.gw, K.org, K.min and CEC.min were similar: between -97.2 and -100.1°. Nearly similar was vector of pH.min (-93.9°). Next CEC.org (-88.0°) and pH.org (-87.0°) (Table 4).

Table 4: Approximate directions of concentration vectors attained via combined regression by [Lat; Long] and its coefficients (C).
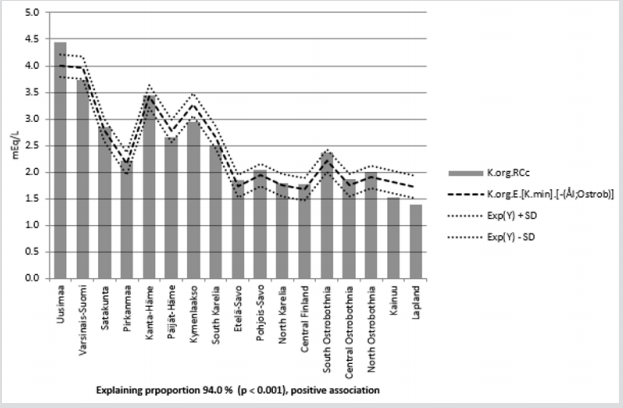
Figure 1: Regional K.org and its regression by K.min.
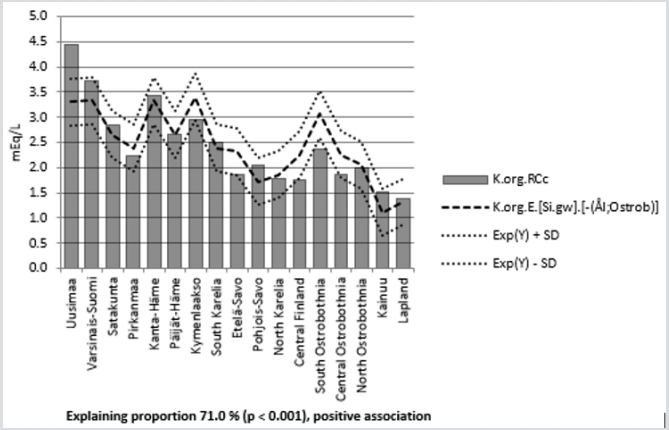
Figure 2: Regional K.org and its regression by Si.gw.
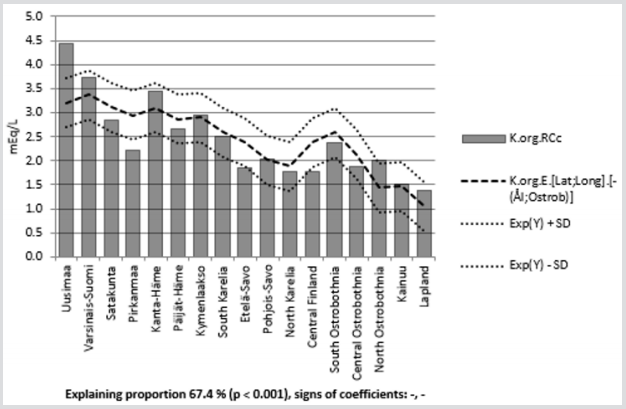
Figure 3: Regional K.org and its combined Regression by Latitude and Longitude.
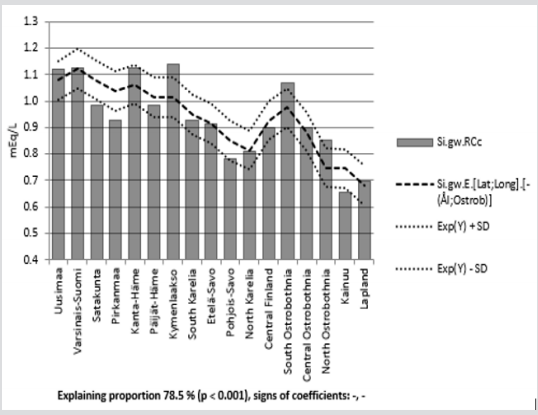
Figure 4: Regional Si.gw and its combined Regression by Latitude and Longitude.
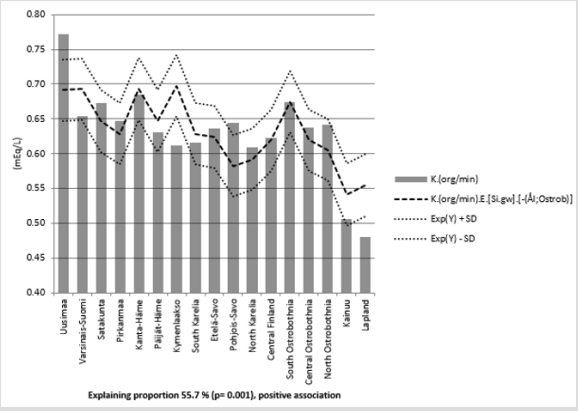
Figure 5: Regional K.(org/min) and its regression by Si.gw.
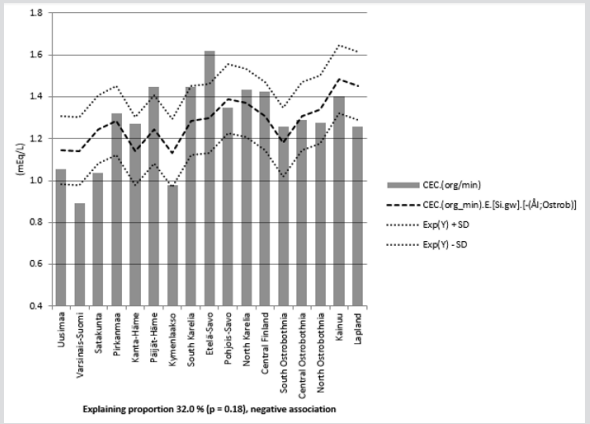
Figure 6: Regional CEC. (org/min) and its regression by Si.gw.
Discussion
In 1986-90 regional K, CEC and pH values in organic and mineral agricultural soils and K.(org/min) from continental Finland were significantly associated with each other and regional Si.gw (Table 3), and so obviously with regional weathering rate. This is in concordance with old texts: CEC is an inherent soil characteristic and is difficult to alter significantly [1,12]. Ostrobothnia “(16). Österbottens Svenska” RC was excluded because of statistical deviation. (This deviation was obviously not earlier reported). This increased Si.gw associations with other parameters including CEC (can be calculated by data in Table 1). Anyhow even median of Si.gw in “(16). Österbottens Svenska” (1.10) was higher than Finnish provincial mean (0.94) (Table 2).
Regional CEC in organic soils was higher than in mineral soils: CEC.(org/min) was 1.28 oppositely to K.(org/min), which was 0.63 (Table 3). Independently of this regional CEC.org, CEC.min, K.org and K.min were explained each other and Si.gw and were explained by [Lat;Long] (Fig.’s 1 – 4). Si.gw explained significantly all parameters, even ratio K.(org/min) by 55.7 % (p = 0.001), with positive coefficients (Figures 5). Regional (autumnal) [6] K.org and K.min [6], associations (Table 3) with Si.gw suggests on regional K buffer association with Si.gw (Table 3). Positive association of K.(org/min) and negative association of CEC. (org/ min) with Si.gw is not satisfactorily explained, e.g. because of carbon content of soil samples were not available. - (Figures 5 & 6).
Approximate directions of concentration vectors of Si.gw, K.org, K.min and CEC.min were similar: between -97.2 and -100.1°. Nearly similar was vector of pH.min (-93.9°) (Table. 3).
Associations with [Lat;Long] can be explained by soil ageing [13] [e.g. erosion (Weathering + transportation)]: In the Finnish map we see that eastern and northern parts of Finland are more far from Baltic see: more loss and less receiving of mineral than on downhill areas and via post-glacial earth elevation from Baltic sea [14]. So aged soils (and peat soils) are poor in cations and Si. . Fig’s. 3 and 4 show similar high associations of Si.gw and K.org with [Lat;Long]. Main vector directions towards south-southwest (Table 4) – higher association with Lat than Long suggest on temperature association.
Silicate weathering is known to sequestrate carbon: CaSiO3 + 2CO2+ + H2O -> Ca++ + 2HCO-- +SiO2 (soluble) [15]. This has not been strong enough to stop the carbon loss (220 kg ha/yr in 1974– 2009 [16] from Finnish agricultural soils, although soils have been supplemented by big amounts of carbonate liming agents (mixtures of CaCO3 and MgCO3), which contain ca 12 % carbon. Opposite to other soil-types, in (easily weatherable) clay soils of southern Finland carbon content has increased between 1998 and 2009 independent on soil management (annual cropland, perennial cropland or crop rotation) [16].
Microbiological procedures are obviously important for silicate weathering, e.g. [17,18]. Silicate fertilizers (big amounts) in dry soil can work anyhow as cationic adsorbents [19]. It has been suggested that systems draining soils (streams) with greater cation exchange capacity release more CO2+ to atmosphere than those draining poor soils based on observation that silty stream was more supersaturated than sandy stream, at approximately an order of magnitude more saturated than atmospheric equilibrium [20]. Possibly this is only sign of higher C sequestration [15] in silty stream, which obviously contained more Si.
In general, most gramineous plants (e.g. ryegrass, wheat, triticale, sorghum, rye, corn and barley) are known as Siaccumulating species [21]. Possibly mainly for this reason plowing (after some years of grass cultivation) seemed to increase plant silicon content [9], when the accumulated Si is liberating from debris to soil and plants.
In the Figures of [22] it seems impossible in Finland to reach the target pH-level 6.1 in coarse mineral soils of Lapland. Maximal yields have been obtained e.g. by winter wheat even at pH-level 5.7 [23] Possibly oligomers of condense Si(OH)4, with pK 6.8 of its silanol (Si-O-H) groups on the outside of oligomers is [23], can work as a buffering agent in agricultural soils. Studies on silicates as liming agents are suggested: Maximal yields can be attained by different fertilization ratios and in different pH levels in Si supplemented than in Si exhausted soils.
By improving water control via reduction of transpiration [25] Si could even rejuvenate eroded soils. Soil CEC associations with Si (Table 3), i.e. nutrient and retention, could possibly be explained by Si(OH)4 polymers [26], which can support the water control, too. Old studies have suggested on the role of silicates as fertilizers [27]. In the future they can have an increased role as liming agets (by reducing the carbon loss via carbonate liming agents) and as carbon scavengers in general.
PS. In calculations CEC values included one decimal, but in Table 1 values are given without decimals because of scanty space.
Conclusion
In continental Finland regional Si.gw – obviously associated with weathering rate - explained significantly variation in K.org, K.min, K buffer, CEC.org, CEC.min, pH.org, pH.min, K.(org/min) and CEC.(org/min). Association of Si.gw with soil inorganic carbon is discussed.
Acknowledgement
I am grateful to Professor Osmo Hänninen and late veterinary surgeon Seppo Haaranen for several discussions.
References
- Brown K, Lemon J (2019) Cations and Cation Exchange Capacity. web: soilquality.org.au.
- Rayment GE, Higginson FR (1992) Electrical Conductivity. In ‘Australian Laboratory Handbook of Soil and Water Chemical Methods’ Inkata Press: Melbourne.
- Saarela I, Huhta H, Salo Y, Sippola J, Vuorinen M (1998) Kaliumlannoituksen porraskokeet 1977-1994. Maatalouden tutkimuskeskuksen julkaisuja. Sarja A 42. Agricultural Research Centre of Finland. Vammalan kirjapaino Oy. ISSN 1238-9935, ISBN 951-723-523-5.
- Cation-Exchange Capacity. Wikipedia.
- Saarela I (1983) Response of timothy to increasing rates of potassium. Journal of Scientific Agricultural Society of Finland. Maataloustieteellinen Aikakauskirja 55(2): 163-178.
- (2010) Eurofins Viljavuuspalvelu (personal communication).
- Lahermo P, Tarvainen T, Hatakka T, Backman B, Juntunen R, et al. (2002) Tuhat kaivoa - Suomen kaivovesien fysikaalis-kemiallinen laatu vuonna 1999. Summary: One thousand wells - the physical-chemical quality of Finnish well waters in 1999. Geological Survey of Finland, Report of Investigation 155, and Groundwater database of Geological Survey of Finland 2017.
- (2015) Liite_1.2’. Eri maalajien keskimaarainen happamuus ja_86_90.xls 117.50 KB. (Acidity and mineral element contents per soil-types in Finnish Rural Centres 1986-90. Permission Jan 8, Eurofins Viljavuuspalvelu Oy.
- Toysa T, Osmo Hanninen (2016) Soil Weathering, Silicon and CHD in Finland. J Agriculture 2(1): 008.
- Official Statistics of Finland: Farm Register [printed product]. ISSN = 0784-8404. 1988. Agriculture and forestry 1990: 2. Table 2.7.: Land use on farms by Agricultural Advisory Centre according to municipality 31.12.1988 (“Maatilojen maankäyttölajit maatalouskeskuksittain ja kunnittain 31.12.1988”). Helsinki: National Board of Agriculture. (Map of Rural Centres - Agricultural Advisory Centres on page 16).
- Töysa T (2018) Rainy Days, Geographic Coordinates, Vitamin D, Silicon, Selenium and CHD in Finland in 1962-2014. Biomed J Sci & Tech Res.
- Timo T, Osmo H (2017) Soil Ph, Ca and Mg Stability and pH Association with Temperature and Groundwater Silicon. Biomed J Sci & Tech Res 1(7).
- Ma JF, Takahashi E (2002) Soil, Fertilizer, and Plant Silicon Research in Japan. Chapter 8: Summary and prospect of Silicon research. Section 8.1.1 pp. 181-190.
- Tikkanen M, Oksanen J (2002) Late Weichselian and Holocene shore displacement history of the Baltic Sea in Finland. Fennia International J of Geography 180: 1-2.
- Carbonate-silicate cycle, Wikipedia.
- Heikkinen J, Ketoja E, Nuutinen V, Regina K (2013) Declining trend of carbon in Finnish cropland soils in 1974–2009. Global Change Biology.
- Frey B, Rieder SR, Brunner I, Plötze M, Koetzsch S, et al. (2010) Weathering-associated bacteria from the Damma glacier forefield: physiological capabilities and impact on granite dissolution. Appl Environ Microbiol 76(14): 4788-4796.
- Gosling P, Hodge A, Goodlass G, Bending DG (2006) Arbuscular mycorrhizal fungi and organic farming. Agriculture, Ecosystems and Environment 113: 17-35.
- Bolland M, Baker M (2000) Powdered granite is not an effective fertilizer for clover and wheat in sandy soils from Western Australia. Nutrient Cycling in Agroecosystems 56: 59.
- Sousa ES, Salimon CI, Victoria RL, Krusche AV, Alin SR, et al. (2008) Dissolved inorganic carbon and pCO2+ in two small streams draining different soil types in Southwestern Amazonia, Brazil. Ambiente & Água - An Interdisciplinary Journal of Applied Science.
- Liang Y, Nikolic M, Belanger R, Gong H, Song A (2015) Silicon in Agriculture. From Theory to practice. Springer p. 75.
- Keskinen R, Ketoja E, Heikkinen J, Salo T, Uusitalo R, et al. (2016) 35-year trends of acidity and soluble nutrients in cultivated soils of Finland. Geoderma Regional 7: 376-387.
- Mahler RL, McDole RE (1987) Effect of soil pH on crop yield in northern Idaho. Agron J 79:751-755.
- Belton DJ, Deschaume O, Perry CC (2012) An overview of the fundamentals of the chemistry of silica with relevance to bio silicification and technological advances. FEBS J 279(10): 1710 1720.
- Ma JF, Takahashi E (2002) Soil, Fertilizer, and Plant Silicon Research in Japan. 7.2.2.2. Water stress pp. 151-154.
- Kieselsä Wikipedia.
- Bernard R (1894) Introduction to Bread Prom Stones. From Bread from Stones: A New and Rational System of Land Fertilization and Physical Regeneration by Dr. Julius Hensel (Agricultural Chemist). Translated from the German.
