 Research Article
Abstract
Background: Despite remarkable progress in treatment, patient management and increased survival rate, childhood acute lymphoblastic leukemia (ALL) remains a major public health problem. Traditionally white blood cell count (WBC) at diagnosis has been used as a prognostic marker. However, the molecular mechanisms and biological pathways modulating WBC have not been characterized. Here, we investigated whether genomic alterations in childhood ALL patients diagnosed with high (HWBC) and patients diagnosed with low (LWBC) could lead to measurable changes distinguishing the two patient groups and discovery of signaling pathways modulating WBC.
Methods: We addressed this knowledge gap by comparing gene expression levels between 99 patients diagnosed with LWBC and 108 patients diagnosed with HWBC. Highly significantly differentially expressed genes resulting from the analysis were subjected to network and pathway analysis using the Ingenuity pathway analysis (IPA) software.
Results: We discovered a signature of 289 highly significantly differentially expressed genes distinguishing patients with LWBC from patients with HWBC. We discovered gene regulatory networks containing functionally related genes with overlapping functions. The investigation revealed multiple biological pathways including protein ubiquitination, NRF2-mediated oxidative stress response, FGF, AMPK, CD40, Erythropoietin, JAK/STAT, B cell receptor, STAT3, IL-12, Role of JAK1, JAK2 and TYK2 interferon and P53 signalling pathways dysregulated in response to increased WBC.
Conclusion: The investigation revealed a prognostic signature distinguishing patient diagnosed with LWBC from patients diagnosed with HWBC. Additionally, the study revealed multiple signaling pathways modulating WBC, which could serve as therapeutic targets. Further research is recommended to integrate transcriptome data on WBC with information on other prognostic markers.
Keywords: Transcription Profiling White Blood Cell Count Childhood ALL
Abbreviations: ALL: Acute Lymphoblastic Leukemia; WBC: White Blood Cell Count; NCI: National Cancer Institute; HWBC: High WBC; LWBC: Low WBC; TARGET: Therapeutically Applicable Research to Generate Effective Treatments; COG: Children’s Oncology Group; IPA: Ingenuity Pathway Analysis; GO: Gene Ontology; STAT: Signal Transducer and Activator of Transcription; JAKJ: Janus Kinase; HMGA1: High Mobility Group A1
Introduction
Acute Lymphoblastic Leukemia (ALL) is the most common diagnosed childhood cancer and the leading cause of cancer-related death among children in the US [1,2]. An estimated 6000 new cases (3,400 males and 2,600 females) of acute lymphoblastic leukaemia (ALL) are diagnosed annually in the US [1,2]. Over the last several decades, treatment of ALL has advanced significantly, with 5-year event free survival rates of over 90% [1,2]. This remarkable progress in treatment and improvement in outcomes can be attributed to new protocols that rely on stratifying patients into risk groups based on the underlying biological and clinical characteristics, as well as the success of initial treatment response with respect to chemotherapy treatment [3]. However, despite the dramatic improvements in both event-free survival rates and overall survival, significant challenges remain. One of the more significant challenges is that 10%-20% of the patients still do not respond to the current treatment protocols, while among the patients who initially respond to treatment, 20-30% tend to relapse [3-5]. Moreover, the overall cure rate for relapsed patients remains low, despite intensified chemotherapy and stem cell transplantation [3-5]. Therefore, there is an urgent need for the discovery of novel prognostic markers and targets for the development of novel targeted therapies.
Traditionally, white blood cell count (WBC) in peripheral at diagnosis has been one of the strongest independent predictors of induction failure, resistant disease and risk of relapse in pediatric ALL [6,7]. Accordingly, WBC has been used to stratify patients and to guide treatment decisions [6,7]. Large epidemiologic studies have investigated the prognostic impact of WBC in ALL and shown that non-remission and relapse patients consistently have high WBC than those in remission [7]. Crucially, current treatment protocols developed using phase 3 clinical trials conducted by pediatric oncology consortia in Europe and in North America have demonstrated that initial white blood cell (WBC) is a consistent predictor of clinical outcomes [8,9]. Moreover, WBC has been incorporated in the National Cancer Institute (NCI) Rome criteria protocols for risk stratification of children with ALL [10,11]. Yet, despite the large available body of knowledge about WBC as a powerful prognostic marker and a predictor of relapse in ALL [10,11], the molecular mechanisms and the biological pathways modulating WBC have not been well characterized.
Over the last decade, advances in microarray technology have enabled molecular classification of subtypes of ALL [12-14]. Discoveries from microarray technology have provided insights about the molecular basis of childhood ALL [15,16]. Recently Edwards et al. reported a gene signature of high WBC in ALL using a small sample of gene expression data [17]. However, the study did not characterize the gene regulatory networks and signaling pathways modulating WBC. A deeper understanding of the genomic differences between patients diagnosed with high WBC (HWBC) and patients diagnosed with low WBC (LWBC), as well as the elucidation of the “druggable” pathways dysregulated by genomic alterations in response to increased WBC, should improve patient stratification and speed the development of novel targeted therapeutics.
The Objectives of this Investigation were
a) To discover and characterize the molecular signature distinguishing patients diagnosed with LWBC from patients diagnosed with HWBC, and
b) To elucidate gene regulatory networks and signaling pathways modulating WBC in childhood ALL. Our working hypothesis is that genomic alterations in ALL patients diagnosed with WBC could lead to measurable changes guiding therapeutic decision making by distinguishing patients with HWBC from patients with LWBC. We further hypothesized that genomic alterations in genes distinguishing the two patient groups affect entire molecular networks and signaling pathways which are dysregulated in response to increased WBC. We addressed these hypotheses using publicly available gene expression data from the Therapeutically Applicable Research to Generate Effective Treatments (TARGET) https:// ocg.cancer.gov/programs/target/data-matrix Phase I dataset on childhood ALL [18].
Material and Methods
Source of Gene Expression Data
We used publicly available gene expression data generated from a total of 207 patients diagnosed with high risk pediatric B-cell ALL enrolled in the Children’s Oncology Group (COG) Study P9906 a phase I clinical trial. Gene expression data and associated clinical information were generated by the Therapeutically Applicable Research to Generate Effective Treatments (TARGET) project https://ocg.cancer.gov/programs/target/data-matrix [18]. Gene expression data was downloaded from the National Center for Biotechnology Information (NCBI’s) Gene Expression Omnibus (GEO) database (http://www.ncbi.nlm.nih.gov/gds/) under accession number GSE11877 [15,16]. The details about sample processing and experimental protocol have been provided by the data originators [15,16]. Because the same TARGET barcode structure was used for both clinical data and molecular data, we used the barcodes structure to integrate patient-based clinical information with sample-based gene expression data. All patients were treated uniformly with a modified augmented Berlin-Frankfurt-Münster Study Group (BFM) regimen [15,16]. This trial targeted a subset of newly diagnosed high-risk ALL patients, which have experienced a poor outcome (44% relapse-free survival (RFS) at 5 years) in prior studies [15,16].
Patients with central nervous system disease or testicular leukemia were eligible for the trial regardless of age or WBC count at diagnosis. Patients with very high-risk features (BCR-ABL1 or hypodiploidy) were excluded, whereas those with low-risk features (trisomies of chromosomes 4 or 10; t [12;21] [ETV6-RUNX1]) were included unless they had central nervous system disease or testicular leukemia. For this study, previously cryopreserved residual pre-treatment leukemia specimens were available on a representative cohort of 207 with gene expression data and clinical information. The sample distributions were 108 patients diagnosed with HWBC and 99 patients diagnosed with LWBC. LWBC was defined as initial WBC of < 50,000/mm3 , and high HWBC was defined as initial WBC count ≥ 50,000/mm3 . The patient age ranged from 0 to 21years. The gene expression dataset contained 54,613 probes and was processed using the Affymetrix Human Genome U133 Plus 2.0 Array chip using standard Affymetrix protocol. The probes from the U133 Plus 2.0 chip were mapped to gene names using the batch query as implemented in the Affymetrix database Net Affx to annotate the probes with matching gene symbols. The data was processed to remove spiked controls.
Analysis of Gene Expression Data
The data was normalized, and log transformed using a log2. Using the log transformed data, we compared gene expression levels between patients diagnosed with LWBC and patients diagnosed with HWBC, by fitting the data to a linear model and performing empirical Bayes moderated statistical tests using the Limma package [19] as implemented in Bioconductor using R 3.5.0 [20] to obtain estimates of p-values and log-fold-change (LFC) values as measures of the differences in gene expression levels between the two patient groups. We used the false discovery rate procedure to correct for multiple hypothesis testing [21]. The p-value was adjusted for censored variables such as age and gender. The genes were ranked on adjusted p-values, LFC and the false discovery rate. A significant adjusted p-value of P< 0.05 was used as the threshold for declaring significant differential expression. To determine whether the significantly differentially expressed genes distinguishing the two patient groups are functionally related and have similar patterns of expression profiles, we performed hierarchical clustering using a set of the most highly significantly differentially expressed genes between the two patient groups. For hierarchical clustering we used the Pearson correlation coefficient as the measure of distances between pairs of genes and complete linkage as the clustering method.
Hierarchical clustering was performed using Morpheus software developed by the Broad Institute [22]. We performed network and pathway analysis and visualization using the Ingenuity Pathway Analysis (IPA) system [23]. For IPA analysis, gene symbols approved by the Human Genome Organization’s Nomenclature Committee for the most highly significantly differentially expressed genes distinguishing patients diagnosed with LWBC from patients diagnosed with HWBC were mapped onto networks and canonical pathways as implemented in IPA [23]. Using the network and pathway design and analysis modules as implemented in IPA, we identified the most significant molecular networks and pathways, by computing the probability scores (Z-scores) for molecular networks and the log P-values for functional category and signaling pathways, to assess the likelihood and reliability of correctly assigning the genes to the correct networks, functional category and signaling pathways. Molecular functions, biological processes, and cellular components in which the genes are involved were assessed using the Gene Ontology (GO) [24] information as implemented in IPA.
Results
Traditionally, clinicians and pediatric hematology and oncologists have used WBC at diagnosis in childhood acute lymphoblastic leukemia as a prognostic marker to guide therapeutic decision making at the point of care. However, to date, the molecular mechanisms modulating WBC have not been characterized. This investigation was conducted to address this knowledge gap. Here we summarize the findings from this investigation.
Discovery of a Gene Signature Modulating WBC
The first objective was to discover and characterize the molecular signature distinguishing patients diagnosed with LWBC from patients diagnosed with HWBC. We hypothesized that genomic alterations in ALL patients diagnosed with WBC could lead to measurable changes guiding therapeutic decision making by distinguishing patients with HWBC from patients with LWBC. To address this hypothesis, we compared gene expression levels between the 99 patients diagnosed with LWBC and the 108 patients diagnosed with HWBC. After correcting for the false discovery rate, the analysis produced a signature of 5,683 significantly differentially expressed genes at a nominal p-value (P<0.05). Evaluation of significantly differentially expressed genes using the estimates of p-values and FDR revealed a signature of 289 highly significantly (P<0.0001; FDR≤0.01) differentially expressed genes distinguishing the two patient groups. This confirmed our hypothesis that genomic alterations in patients diagnosed with HWBC and patients diagnosed with LWBC could lead to measurable changes affecting therapeutic decision making by distinguishing the two patient groups. A list of the 27 most highly significantly (P< 0.00001; FDR <0.01) differentially expressed genes distinguishing patients diagnosed with HWBC from patients diagnosed with LWBC are presented in Table 1. A complete list of all the 289 highly significantly differentially expressed genes distinguishing the two patient groups are presented in Table S1 provided as supplementary data to this report.
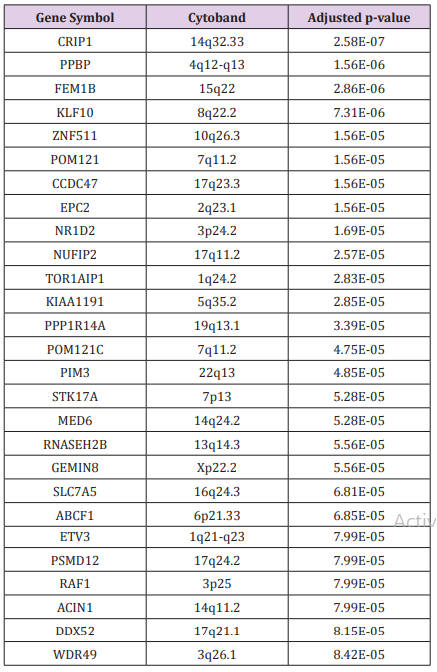
Table 1: List of the topmost highly significantly (P<10-5) differentially expressed genes distinguishing patients diagnosed with HWBC from patients diagnosed with LWBC.

Table S1: List of all the 289 highly significantly differentially expressed genes distinguishing patients diagnosed with LWBC from patients diagnosed with HWBC.
Patterns of Gene Expression Profiles for the Genes Distinguishing the Patient Groups
To address the hypothesis that genes dysregulated in response to increased WBC and distinguishing the two patient groups are co-regulated and have similar patterns of expression profiles, we subjected the 289 highly significantly differentially expressed genes to hierarchical clustering. The results of hierarchical clustering are presented in a heat map in Figure 1. In the figure, genes are represented in the rows and patients in the columns. The analysis revealed two major clusters of up (red colour) and down (blue colour) co-regulated genes with similar patterns of expression profiles. Among the most highly significant differentially expressed, the genes PPP1R14A, LINC01013, TMEM71, IQCN, P4HA2, IGF2BP3, TRAP1 and LCN8 were up regulated, whereas the genes PPBP, SCML1, DDX3Y, MAF, TADA2B, NDFIP1, HIC1, METRNL, NARF and PPP1R16B were down regulated. It is worth noting that due to the large number of genes in the heat map, we could not fit all the gene symbols in the heat map.
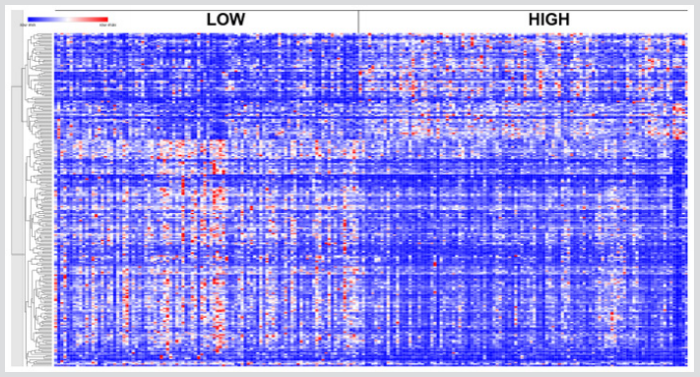
Figure 1: Patterns of gene expression profiles for the 289 highly significantly differentially expressed genes distinguishing patients diagnosed with LWBC from patients diagnosed with HWBC, herein denoted as LOW and HIGH, respectively. Red indicates upregulated and blue indicates down regulated. The genes are represented in rows and patients are represented in columns.
There was significant variation in patterns of gene expression profiles across patient samples in both the LWBC and HWBC. The variability in patterns of gene expression profiles within and across the two patient groups can be partially explained by the heterogeneity of the disease [6]. The groups with LWBC and HWBC contain patients with biologically heterogeneous subtypes of ALL and many cytogenetic subsets with different prognostic impact [6]. Moreover, because ALL is inherently a heterogeneous disease involving many subtypes, gene expression may be subtype specific. Our analysis included different subtypes, under such conditions the observed outcome may be expected and is consistent with epidemiologic literature [6]. Overall the discovery of a gene signature distinguishing the two patient groups suggests that the discovered genes could serve as clinically actionable prognostic markers.
Gene Regulatory Networks and Signalling Pathways Modulating WBC
The second but equally important objective of this investigation was to elucidate gene regulatory networks and signaling pathways modulating WBC in childhood ALL. We hypothesized that genomic alterations in genes distinguishing the two patient groups affect entire molecular networks and signaling pathways which are dysregulated in response to increased WBC. To address this hypothesis, we performed network and pathways analysis using the 289 genes highly dysregulated in response to increased WBC, using IPA. The analysis revealed 18 molecular networks with Z-scores ranging from 2 to 53 containing functionally related genes with overlapping functions. The results showing gene regulatory networks are presented in Figure 2. The molecular networks included genes predicted to be involved in connective tissue disorders, developmental disorder, hereditary disorder, amino acid metabolism, post-translational modification, small molecule biochemistry, cell cycle, cell death and survival and gene expression. In addition, the analysis revealed molecular networks containing genes predicted to be involved in cellular assembly and organization, cellular function and maintenance, cell-to-Cell signaling and interaction, cellular function and maintenance, inflammatory response, cellular development, cellular growth and proliferation, hematological disease, inflammatory response, and organismal injury and abnormalities.
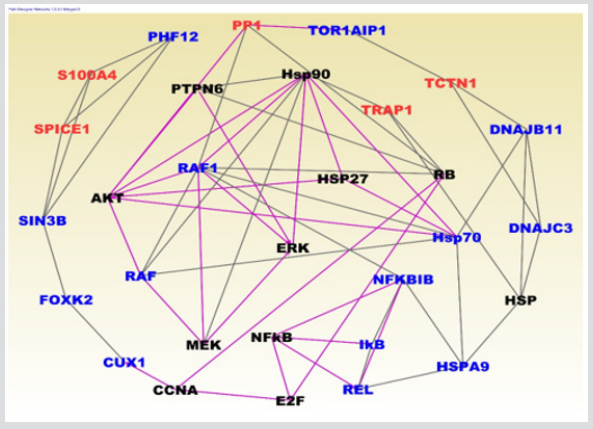
Figure 2: Molecular networks containing up (red font) and down (blue font) regulated genes showing interactions among differentially expressed genes identified in WBC analysis. The solid lines indicate functional relationships and overlapping functions. The black font indicates IPA generated genes functionally related to input genes.
Analysis of upstream regulators in network regulation revealed KLF3, FOXN3, SGPP2 and FOLR1. In addition to evaluation of genes in the networks for the molecular functions, biological processes and cellular components in which they are involved, we also evaluated them for expression. The results are presented in Figure 2 for genes with ≥3 interactions. In Figure 2, upregulated genes are represented in red fonts and down regulated genes in blue font. The analysis revealed up and down regulated genes interacting in gene regulatory networks Figure 2. The genes PP1, S100A4, SPICE1, TRAP1 and TCTN1 were upregulated whereas as the genes PHF12, SIN3B, FOXK2, CUX1, RAF, RAF1, IKB, REL, NFKBIB, HSPA9, HSP70, DNAJC3 and DNAJB11 were up regulated (Figure 2). Note that the analysis revealed many up and down regulated genes in network analysis, but due to filtering of the networks to remove genes with spurious interactions only a small number of up and down regulated genes are presented here. Many of the discovered genes in the networks are involved in the molecular mechanisms of cancer.
To gain insights about the broader biological context in which the differentially expressed genes operate and to discover potential targetable pathways, we performed pathway analysis. The results of pathway analysis are presented in Figure 3. In the Figure, only the pathways found to be significant as determined by the log p-values as shown by the threshold yellow vertical line are presented. Pathways analysis revealed many important signalling pathways dysregulated in response to HWBC (Figure 3). The most highly significant (-log(p-value > 1.30)) Increased signalling pathways were: protein ubiquitination, NRF2-mediated oxidative stress response, FGF, AMPK, CD40, Erythropoietin, JAK/STAT, B cell receptor, STAT3, IL-12, Role of JAK1, JAK2 and TYK2 interferon and P53 signalling pathways (Figure 3). The analysis confirmed our hypothesis that genomic alterations in genes distinguishing patients diagnosed with LWBC from patients diagnosed with HWBC affect entire molecular networks and signaling pathways. As discussed below in the discussion section, the discovered signaling pathways have been implicated in childhood ALL, and thus have the promise to serve as potential therapeutic targets or could be used for the development of novel therapeutics.
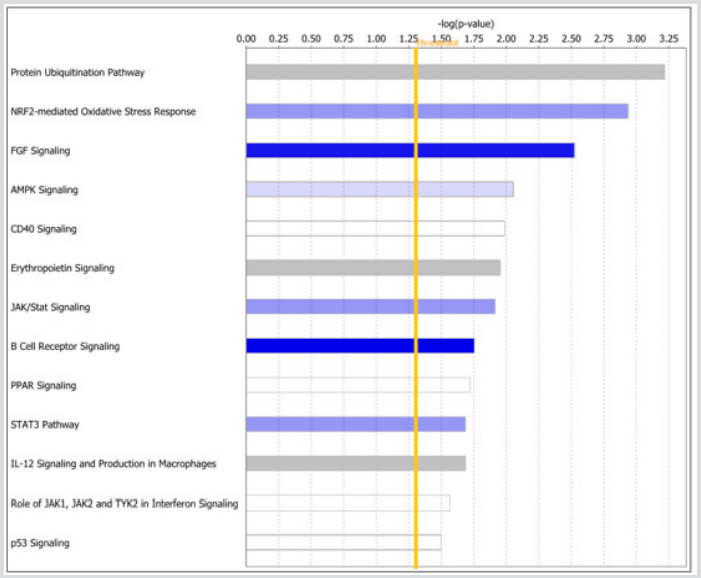
Figure 3: The topmost highly significant signalling pathways modulating WBC. Y-axis shows the names of pathways ranked by log p-value. The x-axis (upper) shows the log p-values indicating the level of significance. The vertical yellow line indicates the threshold levels above which the signalling pathway is declared significant.
Discussion
Historically WBC in peripheral blood at diagnosis has been used as a prognostic marker in childhood ALL [6,7,10,11]. A key knowledge gap and critical unmet need has been the elucidation of the molecular mechanisms and biological pathways modulating WBC. Here we used transcription profiling comparing gene expression levels between patients diagnosed with LWBC and patients diagnosed with HWBC to address this knowledge gap and unmet need. The investigation revealed a molecular signature distinguishing patient diagnosed with LWBC from those diagnosed with HWBC. Additionally, the analysis revealed multiple gene regulatory networks and signalling pathways dysregulated in response to increased WBC. We discuss the significance of these findings in the context of potential clinical applications.
Prognostic Signature
The discovery of a gene signature distinguishing patients diagnosed with LWBC from patients diagnosed with HWBC suggests that transcription profiling could be used for risk stratification of ALL patients to identify patients at high risk who could be prioritized for intensified treatment. This could have significant impact considering that patients with HWBC in peripheral blood ≥200x109/L at diagnosis constitute 5-8% of all childhood ALL patients and are known to have significantly lower survival rates [6,12]. Prioritization of patients with HWBC for intensified treatment could lead to improved outcomes since this group of patients fare less well in outcomes [25].
Guiding Therapeutic Decisions
One of the lingering questions by clinicians has been to decide whether maintenance therapy for childhood ALL should be revised such that drug doses are adjusted by white blood cell, neutrophil, or lymphocyte counts [10]. This investigation addressed this question and provides a rational basis for adjusting therapy by WBC. That could be achieved by identifying the patients with HWBC who could be prioritized for intensified treatment and the genes modulating WBC levels which could serves as prognostic markers.
Complementing Current Treatment Protocols
Current risk stratification and treatment algorithms incorporate age, sex, WBC, degree of central nervous system involvement, established cytogenetic alterations, and measurement of levels of Marginal Residue Disease (MRD) at early time points during therapy [26-28]. However, although modulation of treatment intensity based on MRD levels has been an important factor in improving outcomes of therapy for patients with childhood ALL [26,29], the genomic features modulating MRD such as IKZF1 alterations and Ph-like ALL have been associated with poor outcome in many studies [30-31]. Importantly, their ability to refine prognosis in studies incorporating intensive therapy and measurement of MRD has varied between studies and cohorts [32-34]. Therefore, new genomic information such as genes dysregulated in response to HWBC could be used as prognostic markers to complement the information in current clinical algorithms.
Signalling Pathways as Potential Therapeutic Targets
In this study, we discovered multiple signalling pathways implicated in childhood ALL, including protein ubiquitination, NRF2-mediated oxidative stress response, FGF, AMPK, CD40, Erythropoietin, JAK/STAT, B cell receptor, STAT3, IL-12, Role of JAK1, JAK2 and TYK2 interferon and P53 signalling pathways. The significance of these findings is that these pathways could serve as potential therapeutic targets and or targets for the development of novel therapeutics. The involvement of ubiquitination signalling pathway has clinical significance because ALL cells have been shown to be sensitive to disturbances in protein homeostasis induced by proteasome deubiquitinate inhibition [35]. The FGF receptor signalling pathway is recurrently involved in leukemogenic processes, and recombinant ligand FGF2 has been shown to reduce the response to prednisolone in several BCP-ALL cell lines In vitro [36]. The AMPK signalling pathway is involved in programmed cell death, a crucial biological mechanism in the treatment of ALL [37].
The CD40 ligand could be used for immunotherapy of childhood B-cell precursor ALL [38]. The erythropoietin receptor a member of the erythropoietin signalling pathway has been shown to be involved in ETV6/RUNX1-positive ALL, a subtype included in this study [39]. The Janus kinase (JAK)/signal transducer and activator of transcription (STAT) pathway is central to signalling by cytokine receptors, a superfamily of more than 30 transmembrane proteins that recognize specific cytokines and is critical in blood formation and immune response [40]. Most notably, STAT3 inhibitor has been shown to have potent antitumor activity in B-lineage ALL cells overexpressing the high mobility group A1 (HMGA1)-STAT3 pathway [41]. The B cell receptor [42-43] and P53 signalling pathway is one of the most targeted pathways in childhood ALL [44-45]. In addition, these signalling pathways, we also discovered genes involved in cell cycle, cell proliferation and DNA replication and repair pathways, all of which are known to play a role in childhood ALL [46-48].
Future Research Directions
Taken together, the findings is this study have the potential to serve as clinically actionable molecular markers and targets for the development of novel therapeutics. Our investigation focused on use of transcription profiling. The recent surge of next generation sequencing technology provides the opportunity for incorporation of information on germline, somatic and epigenomic alterations into the clinical management of patients with ALL. Such information could be incorporated at several levels in clinical care, including at diagnosis, patient stratification, expanded molecular classification of novel subtypes of childhood ALL with clear prognostic importance. Moreover, sequencing is likely to have an important role in monitoring responses to therapy and immunotherapy by deeply sequencing antigen receptors. Such information could be integrated with transcriptome data by using gene expression levels as intermediate phenotypes.
Conclusion
The investigation revealed that genetic alterations in patients diagnosed with HWBC and LWBC could lead to measurable changes distinguishing the two patient groups. The investigation further revealed multiple molecular networks and signalling pathways dysregulated in response to increased WBC. Future studies integrating transcriptome with other omics data are recommended to understand the full spectrum of childhood ALL and facilitate the realization of precision medicine and precision prevention.
Data Availability
Clinical information available for ALL Phase I (B-ALL) at TARGET: Therapeutically Applicable Research to Generate Effective Treatments: https://ocg.cancer.gov/programs/target.
Gene expression data from ALL Phase I (B-ALL) is available at NCBI GEO database GSE11877: https://www.ncbi.nlm.nih.gov/ geo/query/acc.cgi?acc=GSE11877
References
- Mullighan CG (2012) The molecular genetic makeup of acute lymphoblastic leukemia. Hematology 389-395.
- Iacobucci I, Mullighan CG (2017) Genetic Basis of Acute Lymphoblastic Leukemia. J Clin Oncol 35(9): 975-983.
- Chiaretti S, Gianfelici V, O'Brien SM, Mullighan CG (2016) Advances in the Genetics and Therapy of Acute Lymphoblastic Leukemia. Am Soc Clin Oncol Educ Book 35: 314-322.
- Pui CH, Yang JJ, Hunger SP, Pieters R, Schrappe M, et al. (2015) Childhood Acute Lymphoblastic Leukemia: Progress Through Collaboration. J Clin Oncol 33(27): 2938-2948.
- Roberts KG, Mullighan CG (2015) Genomics in acute lymphoblastic leukaemia: Insights and treatment implications. Nat Rev Clin Oncol 12(6): 344-357.
- Vaitkevičienė G, Forestier E, Hellebostad M, Heyman M, Jonsson OG, et al. (2011) High white blood cell count at diagnosis of childhood acute lymphoblastic leukaemia: Biological background and prognostic impact. Results from the NOPHO ALL-92 and ALL-2000 studies. Eur J Haematol 86(1): 38-46.
- Donadieu J, Auclerc MF, Baruchel A, Perel Y, Bordigoni P, et al. (2000) Prognostic study of continuous variables (white blood cell count, peripheral blast cell count, haemoglobin level, platelet count and age) in childhood acute lymphoblastic leukaemia. Analysis Of a population of 1545 children treated by the French Acute Lymphoblastic Leukaemia Group (FRALLE). Br J Cancer 83(12): 1617-1622.
- Pui CH, Yang JJ, Hunger SP, Pieters R, Schrappe M, et al. (2015) Childhood Acute Lymphoblastic Leukemia: Progress Through Collaboration. J Clin Oncol 33(27): 2938-2948.
- Isshiki Y, Ohwada C, Sakaida E, Onoda M, Aotsuka N, et al. (2017) CD20 positivity and white blood cell count predict treatment outcomes in Philadelphia chromosome-negative acute lymphoblastic leukemia patient’s ineligible for pediatric-inspired chemotherapy. Jpn J Clin Oncol 47(11): 1047-1054.
- Schmiegelow K, Nersting J, Nielsen SN, Heyman M, Wesenberg F, et al. (2016) Maintenance therapy of childhood acute lymphoblastic leukemia revisited-Should drug doses be adjusted by white blood cell, neutrophil, or lymphocyte counts? Pediatr Blood Cancer 63(12): 2104-2111.
- Vaitkeviciene G, Heyman M, Jonsson OG, Lausen B, Harila Saari A, et al. (2013) Early morbidity and mortality in childhood acute lymphoblastic leukemia with very high white blood cell count. Leukemia 27(11): 2259-2262.
- Wang J, Mi JQ, Debernardi A, Vitte AL, Emadali A, et al. (2015) A six gene expression signature defines aggressive subtypes and predicts outcome in childhood and adult acute lymphoblastic leukemia. Oncotarget 6(18): 16527-16542.
- Lilljebjörn H, Fioretos T (2017) New oncogenic subtypes in pediatric B-cell precursor acute lymphoblastic leukemia. Blood 130(12): 1395-1401.
- Tasian SK, Hunger SP (2017) Genomic characterization of paediatric acute lymphoblastic leukaemia: an opportunity for precision medicine therapeutic. Br J Haematol 176(6): 867-882.
- Harvey RC, Mullighan CG, Wang X, Dobbin KK, Davidson GS, et al. (2010) Identification of novel cluster groups in pediatric high-risk B-precursor acute lymphoblastic leukemia with gene expression profiling: correlation with genome-wide DNA copy number alterations, clinical characteristics, and outcome. Blood 116(23): 4874-4884.
- Kang H, Chen IM, Wilson CS, Bedrick EJ, Harvey RC, et al. (2010) Gene expression classifiers for relapse-free survival and minimal residual disease improve risk classification and outcome prediction in pediatric B-precursor acute lymphoblastic leukemia. Blood 115(7): 1394-1405.
- Edwards H, Rubenstein M, Dombkowski AA, Caldwell JT, Chu R, et al. (2016) Gene Signature of High White Blood Cell Count in B-Precursor Acute Lymphoblastic Leukemia. PLoS One 11(8): e0161539.
- Therapeutically Applicable Research to Generate Effective Treatments.
- Ritchie ME, Phipson B, Wu D, Hu Y, Law CW, et al. (2015) limma powers differential expression analyses for RNA-sequencing and microarray studies. Nucleic Acids Research 43(7): e47.
- (2018) R Core Team, R: A language and environment for statistical computing. R Foundation for Statistical Computing, Vienna, Austria.
- Benjamini Y, Hochberg Y (1995) Controlling the false discovery rat: A practical and powerful approach to multiple testing. J Royal Stat Soc Series B 57(1): 289-300.
- Morpheus Software. Broad Institute, Cambridge, MA.
- Ingenuity Pathways Analysis (IPA) system. Ingenuity Systems, Redwood, CA.
- Ashburner M, Ball CA, Blake JA, Botstein D, Butler H, et al. (2000) Gene ontology: Tool for the unification of biology. The Gene Ontology Consortium. Nat Genet 25(1): 25-29.
- Tasian SK, Hunger SP (2017) Genomic characterization of paediatric acute lymphoblastic leukaemia: An opportunity for precision medicine therapeutics. Br J Haematol 176(6): 867-882.
- Tasian SK, Loh ML, Hunger SP (2015) Childhood acute lymphoblastic leukemia: Integrating genomics into therapy. Cancer 121(20): 3577-3590.
- Campana D (2012) Minimal residual disease monitoring in childhood acute lymphoblastic leukemia. Curr Opin Hematol 19(4): 313-318.
- Waanders E, Van Der Velden VH, Van Der Schoot CE, Van Leeuwen FN, Van Reijmersdal SV, et al. (2011) Integrated use of minimal residual disease classification and IKZF1 alteration status accurately predicts 79% of relapses in pediatric acute lymphoblastic leukemia. Leukemia 25(2): 254-258.
- Pui CH, Campana D, Pei D, Bowman WP, Sandlund JT, et al. (2009) Treating childhood acute lymphoblastic leukemia without cranial irradiation. N Engl J Med 360(26): 2730-2741.
- Roberts KG, Morin RD, Zhang J, Hirst M, Zhao Y, et al. (2012) Genetic alterations activating kinase and cytokine receptor signaling in high-risk acute lymphoblastic leukemia. Cancer Cell 22(2): 153-166.
- Roberts KG, Li Y, Payne Turner D, Harvey RC, Yang YL, et al. (2014) Targetable kinase-activating lesions in Ph-like acute lymphoblastic leukemia. N Engl J Med 371(11): 1005-1015.
- Kuiper RP, Waanders E, Van Der Velden VH, Van Reijmersdal SV, Venkatachalam R, et al. (2010) IKZF1 deletions predict relapse in uniformly treated pediatric precursor B‑ Leukemia 24(7): 1258-1264.
- Palmi C, Lana T, Silvestri D, Savino A, Kronnie GT, et al. (2013) Impact of IKZF1 deletions on IKZF1 expression and outcome in Philadelphia chromosome negative childhood BCP-ALL. Reply to “incidence and biological significance of IKZF1/Ikaros gene deletions in pediatric Philadelphia chromosome negative and Philadelphia chromosome positive B‑ cell precursor acute lymphoblastic leukemia”. Haematologica 98(12): 164-
- Palmi C, Valsecchi MG, Longinotti G, Silvestri D, Carrino V, et al. (2013) What is the relevance of Ikaros gene deletions as a prognostic marker in pediatric Philadelphia-negative B‑ cell precursor acute lymphoblastic leukemia? Haematologica 98(8): 1226-
- Mazurkiewicz M, Hillert EK, Wang X, Pellegrini P, Olofsson MH, et al. (2017) Acute lymphoblastic leukemia cells are sensitive to disturbances in protein homeostasis induced by proteasome deubiquitinase inhibition. Oncotarget. 8(13): 21115-21127.
- Jerchel IS, Hoogkamer AQ, Ariës IM, Boer JM, Besselink NJM, et al. (2019) Fibroblast growth factor receptor signaling in pediatric B-cell precursor acute lymphoblastic leukemia. Sci Rep 9(1): 1875.
- Kuznetsov JN, Leclerc GJ, Leclerc GM, Barredo JC (2011) AMPK and Akt determine apoptotic cell death following perturbations of one-carbon metabolism by regulating ER stress in acute lymphoblastic leukemia. Mol Cancer Ther 10(3): 437-447.
- D Amico G, Marin V, Biondi A, Bonamino MH (2004) Potential use of CD40 ligand for immunotherapy of childhood B-cell precursor acute lymphoblastic leukaemia. Best Pract Res Clin Haematol 17(3): 465-477.
- Inthal A, Krapf G, Beck D, Ruth Joas, Max O Kauer, et al. (2008) Role of the erythropoietin receptor in ETV6/RUNX1-positive acute lymphoblastic leukemia. Clin Cancer Res 14(22): 7196-7204.
- Vainchenker W, Constantinescu SN (2013) JAK/STAT signaling in hematological malignancies. Oncogene 32(21): 2601-2613.
- Belton A, Xian L, Huso T, Koo M, Luo LZ, et al. (2016) STAT3 inhibitor has potent antitumor activity in B-lineage acute lymphoblastic leukemia cells overexpressing the high mobility group A1 (HMGA1)-STAT3 pathway. Leuk Lymphoma 57(11): 2681-2684.
- Müschen M (2015) Rationale for targeting the pre-B-cell receptor signaling pathway in acute lymphoblastic leukemia. Blood 125(24): 3688-3693.
- Nahar R, Müschen M (2009) Pre-B cell receptor signaling in acute lymphoblastic leukemia. Cell Cycle 8(23): 3874-3877.
- Li S, Juan CX, Feng AM, Bian HL, Liu WD, et al. (2019) Attenuating the abnormally high expression of AEBP1 suppresses the pathogenesis of childhood acute lymphoblastic leukemia via p53-dependent signaling pathway. Eur Rev Med Pharmacol Sci 23(3): 1184-1195.
- Sam MR, Pourpak RS (2018) Regulation of p53 and survivin by prodigiosin compound derived from Serratia marcescens contribute to caspase-3-dependent apoptosis in acute lymphoblastic leukemia cells. Hum Exp Toxicol 37(6): 608-617.
- Staal FJ, De Ridder D, Szczepanski T, Schonewille T, Van Der Linden EC, et al. (2010) Genome-wide expression analysis of paired diagnosis-relapse samples in ALL indicates involvement of pathways related to DNA replication, cell cycle and DNA repair, independent of immune phenotype. Leukemia 24(3): 491-199.
- Zhou M, Gu L, Li F, Zhu Y, Woods WG, et al. (2002) DNA damage induces a novel p53-survivin signaling pathway regulating cell cycle and apoptosis in acute lymphoblastic leukemia cells. J Pharmacol Exp Ther 303(1): 124-131.
- Kirschner Schwabe R, Lottaz C, Tödling J, Rhein P, Karawajew L, et al. (2006) Expression of late cell cycle genes and an increased proliferative capacity characterize very early relapse of childhood acute lymphoblastic leukemia. Clin Cancer Res 12(15): 4553-4561.
