 Research Article
Abstract
Currently, an active search for new approaches to building expert systems for diagnosing retinal pathologies based on artificial intelligence methods (fuzzy logic methods, neural network approaches, modern classification methods, simulation models) is underway. The effectiveness of such expert systems depends entirely on the completeness of the available space of diagnostic features. The classical calculation of the amplitude and time parameters of the components of an electroretinogram (ERG) and their relations (indices), as well as the analysis of the frequency spectrum of the signal, becomes insufficient for interpreting the data obtained in the developed expert systems.
In this paper, we propose and justify a method for estimating the amplitude-frequency characteristics (AFC) of the retina by processing the signals of the flicker ERG (FERG) and ERG responses to the chess pattern - black-and-white reversal cells (PERG). It is shown that the frequency response is an objective characteristic of the transfer properties of the retina, which depend not only on the type of stimuli acting on it but also on the etiology of retinal pathology. The purpose of the research is to search for additional formalized (digital) signs of retinal pathologies by analyzing the frequency response to expand the attribute space for diagnosis. The photopic FERG and transient PERG responses were recorded in six healthy individuals and six patients with stage I and stage II primary open-angle glaucoma (POAG). The digitized FERG and PERG signals were decomposed into a Fourier series and, taking into account the spectra of test stimuli, the retinal frequency response of different individuals was constructed, and their properties were studied as a dynamic object transforming the spectrum of the test stimulus into the spectrum of the recorded ERG. We proposed to use the coefficients of polynomials smoothing the resulting frequency response as new formalized diagnostic features. Each frequency response is submitted to be divided into two frequency ranges, and each of them uses its own algebraic smoothing polynomial. We used the results of modeling in Matlab Simulink to identify the characteristics of retinal responses to the flicker- and pattern-stimulation.
For the first time, the retinal response has been obtained, objectively reflecting its ability to convert the stimulating spectrum into ERG spectra. The procedure of polynomial approximation of retinal AFC was firstly performed, which allows using the coefficients of approximating polynomials as new formalized features in diagnostics. Based on a simplified simulation model, a negative component (baseline drift) was detected in the patient’s PERG with POAG, and a procedure was proposed for its compensation to eliminate its influence on the results of retinal AFC evaluation.
Keywords: Formalized Signs of Pattern-Erg; Simulation Model; Glaucoma; Amplitude-Frequency Characteristic of the Retina
Abbreviations: PFC: Phase-Frequency Characteristic; POAG: Primary OpenAngle Glaucoma; ISCEV: International Society of Clinical Electrophysiology of Vision; AFC: Amplitude-Frequency Characteristic
Introduction
The diagnostic possibilities of modern electroretinography are determined by a change in the conditions of adaptation and stimulation and the use of various principles of stimulation of the retina with diffuse, multifocal and structured light stimulus to obtain, respectively, scotopic and photopic ganzfeld ERG [1], multifocal ERG [2] and pattern ERG (PERG) [3]. Taking into account modern technical advances in ophthalmologic diagnostics, requirements for the level of processing and analyzing the obtained data and searching for new mathematical tools to increase the information content of electroretinography are also sharply growing today. The classical calculation of amplitude and peak latency of retinal electrical potentials and amplitude ratio (indices) of ERG components becomes insufficient; analysis of the harmonics of the frequency spectrum of the recorded signal also does not provide sufficient information for an in-depth assessment of the functional changes in the retina and their interpretation. Therefore, new approaches to the construction of expert diagnostic systems based on artificial intelligence methods (fuzzy logic methods, neural network approaches, modern classification methods, and simulation models) develop.
All of these approaches to the construction of expert diagnostic systems make it necessary to conduct an active search for additional formalized (digital) signs of retinal pathologies. This search should be carried out by purposeful additional mathematical processing of the recorded ERG, that is, in fact, the “data mining” of the ERG should be performed.
In all methods, the critical point is the selection and evaluation of formalized informative features and comparing them with the norm range. This approach is widely used in the study of dynamic objects and systems in engineering. However, since the retina, from a technical object, is a complex nonlinear dynamic system with strict restrictions on permissible input effects, obtaining an accurate mathematical description of such an object is extremely difficult. For example, too bright light pulses should not be applied to the human eye, or the frequency of light pulses cannot be too low. Creation of expert diagnostic systems on any basis is associated with the need to form training samples in the form of arrays of formalized signs of specific pathologies. Most of these signs are extracted from the recorded ERG, but their number for each type of ERG is relatively small, and the values of parameters for different pathologies often have large areas of mutual intersections, which make it difficult to diagnose. One of the possible ways to obtain new informative features is an additional mathematical transformation of registered types of ERG.
The work aimed to obtain additional formalized signs of ERG responses to rhythmic flashes (flicker ERG or FERG) [1] and ERG responses to the reversal black and white cells of chess pattern (pattern-ERG or PERG) [3] by analyzing the amplitude-frequency properties of the retina. Signs that are allocated when processing ERG by building, analyzing and subsequent approximation of the amplitude-frequency characteristics (AFC) of the retina as a nonlinear dynamic object are intended both for direct visual use and for use in diagnostic systems, including those developed based on artificial intelligence.
Methods
Subject of Research
Using the mathematical processing of digitized ERGs, the spectral composition of the diffuse flicker signal and for structured signal such as a black-and-white alternating chess pattern for healthy eyes were investigated.
Since the analyzed ERGs are periodic signals, their spectrum is discrete and represents a set of harmonic oscillations, which together form the original signal. It is essential that the ERG signal subjected to decomposition in a Fourier series on a repetition period satisfies Dirichlet conditions [4]:
1. The signal must be limited: do not have in finite values.
2. The signal must be piecewise continuous: have a finite
3. The number of discontinuity points of the first kind (jumps and disposable breaks).
4. The signal must be piecewise monotonous: must have a finite number of extrema.
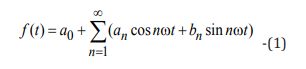
Thus, a periodic ERG signal can be represented by Fourier’s infinite trigonometric series [4]:
where are the row coefficients  determined from ratios?
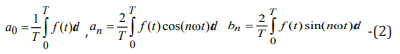
where 
In the expression (1), the coefficient a0 determines the constant component of the periodic signal.
The use of a truncated Fourier series (3), containing only the N first terms instead of an infinite sum, leads to an approximate representation of the signal, which ensures the minimum of the mean square error:
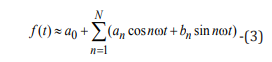
The choice of the number N in this work depends on the level of the noise component of the recorded ERG signal and the duration of the testing pulse. It will be discussed further. The spectra of the FERGs and the transient PERGs were used to assess the frequency properties of the retina. Digitized records of FERG and PERG were obtained from six healthy individuals (39-75 years old) and six patients with a confirmed diagnosis of primary open-angle glaucoma (POAG) stages I and II of the same age group (42-68 years) with TOMEY EP-1000 diagnostic system in compliance with the Standards of the International Society of Clinical Electrophysiology of Vision(ISCEV) [1,3].
Amplitude-Frequency Characteristics (AFC) of the Retina
To describe the properties of dynamic objects in engineering, the concept of the “transfer function” of a dynamic object is widely used [5]. The transfer function of the object allows you to establish a mathematical relationship between the signal arriving at the input of the object, and the observed signal at its output. The transfer function is a stable characteristic for a “linear object” and can be fully described by two features considered together: an amplitude-frequency characteristic (AFC) and a phase-frequency characteristic (PFC). In practice, these characteristics reflect the property of an object to transform the spectrum of the input signal into the spectrum of the observed output signal. The linear object of its frequency response and phase response are stable and do not depend on the type of signal received at its input.
A retina is a non-linear object, and for such an object, we can only talk about the frequency response and phase response for specific types of input testing effects. We studied the possibility of obtaining retinal AFC when exposed to the following diffuse and structured incentives: flickering light pulses of fixed duration with repetition frequencies of 8.3Hz, 10Hz, 12Hz, 24Hz, 30Hz, and alternating black-and-white chess pattern. The output signal (response) of the retina under conditions of preliminary adaptation of the eye to a constant light background is either photopic FERG or, respectively, PERG. For example, such the transformation process of the input test stimulus for FERG can be represented by the flowchart shown in (Figure 1).

Figure 1: Transformation of input testing effect X for FERG (recorded output signal Z).
The input test signal X necessarily reflects the operation of the switch that turns the flash on and off. A flash lamp with its frequency response (WL) converts the input signal X into a change in the light flux X1. Next, the retina with its frequency response (WR) converts the luminous flux into the electrical potential Y, which is recorded with the corresponding device with its frequency response (WD) as FERG (Z). Thus, the spectrum of the recorded signal FERG Z(f) represents the spectrum of the input signal X(f) converted by three dynamic links (lamp-flash, retina, and recording instrument).
This relation can reflect such a process:
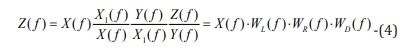
where f is the switching frequency, and each dynamic link in (4) is represented by a spectrum converter (or its frequency response) in the form:

An analog of such a converter for linear dynamic links is its frequency response, which describes the amplifying or attenuating properties of the converter concerning to the amplitude of each specific harmonic input signal of a certain frequency or the magnitude of any particular harmonic in the spectrum of the input signal.
Spectra of input test signals X (f) or test incentives
General view of the input test stimulus X(t) for registration of
the FERG and, accordingly, the test incentive for the registration of
PERG is shown in (Figure 2a). The pulse duration for registering
FERG is fixed τ = 0.005s. Pulse repetition period  For example,
for a pulse repetition rate of 10 Hz,
For example,
for a pulse repetition rate of 10 Hz,  The amplitude of the
pulses A is a relative value and is selected, taking into account the
rationing of the resulting frequency response relative to healthy
subjects. This process is revealed further in work. The test stimulus
is shown in Figure 2b demonstrates the average value A of the
background field of the screen, which shows short pauses with the
duration introduced
The amplitude of the
pulses A is a relative value and is selected, taking into account the
rationing of the resulting frequency response relative to healthy
subjects. This process is revealed further in work. The test stimulus
is shown in Figure 2b demonstrates the average value A of the
background field of the screen, which shows short pauses with the
duration introduced  by the computer when of the chess pattern
cell (black and white) reversed. Because the constant component,
which is present in both test incentives, is not passed by the input
filter of the high frequencies of the recording device, the spectra of
the recorded FERG and PERG have converted pulse spectra in the
test incentives without constant components.
by the computer when of the chess pattern
cell (black and white) reversed. Because the constant component,
which is present in both test incentives, is not passed by the input
filter of the high frequencies of the recording device, the spectra of
the recorded FERG and PERG have converted pulse spectra in the
test incentives without constant components.
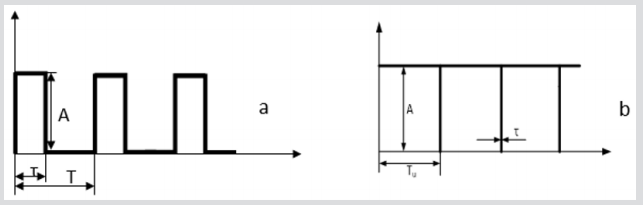
Figure 2: The form of input test incentives X (t): a - for the FERG registration; b – for the PERG registration.
The spectrum of a periodic pulse signal is calculated by decomposing it in a Fourier series on a time interval equal to one pulse repetition period Tu . The analytical form of the record for calculating the harmonics of the spectrum with the numbers n = 1,2,3, ... has the form [5]:
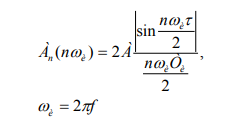
The spectrum is discrete. The frequency of the first harmonic is equal to the pulse repetition frequency; the second harmonic is equal to twice the frequency, etc. The sum of such an infinite series of harmonics accurately reproduces the shape of the input signal X (t). The view of the spectra of the input signal X (f) for pulse repetition frequencies of 10 Hz and 30 Hz is shown in Figure 3.
By [5], the spectra of the pulse sequences have several features [5]:
a) The number of spectrum harmonics in a limited frequency range is inversely proportional to the pulse repetition rate;
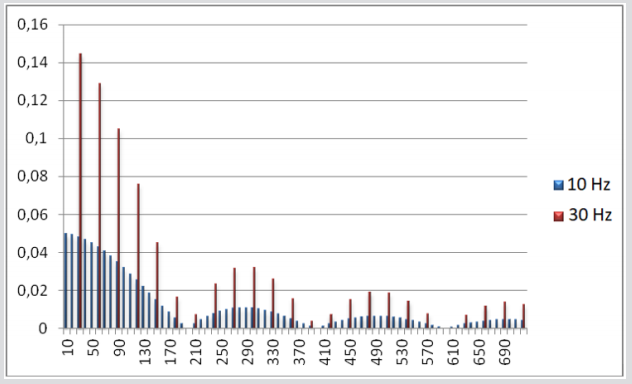
Figure 3: The spectra of the input signal X (f) for pulse repetition rates of 10 Hz and 30 Hz.
b) Amplitudes of harmonics in the signal spectrum are proportional to the pulse repetition rate;
c) There are no harmonics in the spectra at frequencies
multiple to  , and in the vicinity of these frequencies, the
amplitudes of the harmonics are close to zero. For the FERG,
these are the neighborhoods of the frequencies 200Hz, 400Hz,
600Hz, etc.
, and in the vicinity of these frequencies, the
amplitudes of the harmonics are close to zero. For the FERG,
these are the neighborhoods of the frequencies 200Hz, 400Hz,
600Hz, etc.
Result and Discussion
The Frequency Response of the Flash Lamp and Recording Device
The results of the research show that the flash lamp frequency response can be represented as some fixed transmission coefficient KL for the entire frequency range of interest to researchers. Thus, its influence can be taken into account in the form of an amplitude correction A of the input test incentives X.
A high-pass filter is installed at the input of a  recorder,
which does not miss the constant component of the recorded signal
and limits the low frequencies to the lower limit of the uniform
transmission band by about
recorder,
which does not miss the constant component of the recorded signal
and limits the low frequencies to the lower limit of the uniform
transmission band by about  (for the Tomey EP-1000
instrument). Starting from this frequency, at all rates of interest
to the researcher, the device has a uniform bandwidth with a
transmission coefficient equal to
(for the Tomey EP-1000
instrument). Starting from this frequency, at all rates of interest
to the researcher, the device has a uniform bandwidth with a
transmission coefficient equal to  Thus, a recording device can
also be considered a linear proportional link in the bandwidth of
interest. Its transfer coefficient
Thus, a recording device can
also be considered a linear proportional link in the bandwidth of
interest. Its transfer coefficient can also be taken into account as
an amendment to the amplitude of the input signal A. Consultations
with hardware developers allow representing the frequency
response of the recording device
can also be taken into account as
an amendment to the amplitude of the input signal A. Consultations
with hardware developers allow representing the frequency
response of the recording device  graphically in the form
shown in Figure 4.
graphically in the form
shown in Figure 4.

Figure 4: The AFC of the recording device.
Spectrum FERG (Z(f)) and Retinal AFC
The type of FERG as an initial signal, which is decomposed into
a Fourier series on a pulse repetition period with a frequency of 10
Hz, is shown in Figure 5a. FERGs of a healthy subject with normal
vision are considered. It should be noted that the use of FERG
spectra for diagnosis is complicated by the fact that the magnitudes
of the harmonics in them depend on the spectra of the input signals,
in which, according to [5], [5] the amplitudes of the harmonics of
the same name are proportional to the frequency of the supplied
light pulses. Building retinal frequency response  by
dividing the amplitudes of the harmonics of the spectra Z(f) by the
corresponding amplitudes of the harmonics of the input signals, by
[5], eliminates this undesirable effect [6,7]. It should be noted that
in the analyzed spectra the permissible upper limit of the harmonic
frequencies under consideration narrows to 120–150 Hz due to
the influence of the spectrum of the noise component of the FERG
on the frequency response in the vicinity of the critical frequency
200 Hz. In this vicinity, the amplitudes of the harmonics of the
input pulse spectrum are close to zero. This circumstance leads to
the fact that the number of frequency response points for different
frequencies of the supply of light pulses is different and for high
frequencies tiny. For example, for a pulse frequency of 30 Hz, such
points would be 4-5 (Figure 5).
by
dividing the amplitudes of the harmonics of the spectra Z(f) by the
corresponding amplitudes of the harmonics of the input signals, by
[5], eliminates this undesirable effect [6,7]. It should be noted that
in the analyzed spectra the permissible upper limit of the harmonic
frequencies under consideration narrows to 120–150 Hz due to
the influence of the spectrum of the noise component of the FERG
on the frequency response in the vicinity of the critical frequency
200 Hz. In this vicinity, the amplitudes of the harmonics of the
input pulse spectrum are close to zero. This circumstance leads to
the fact that the number of frequency response points for different
frequencies of the supply of light pulses is different and for high
frequencies tiny. For example, for a pulse frequency of 30 Hz, such
points would be 4-5 (Figure 5).
Intermediate points of the retinal frequency response can be obtained by artificially lengthening the period of decomposition of the observed signal (or “window”) with zero values, which is used in radio engineering to determine the side harmonics of the signal under study [8]. In [8], a spectral analysis of a continuous signal with zero expectation (for FERG and PERG, this condition is ensured by the presence of a high-pass filter of a recording device) is performed inside the window. In our case, conditionally delaying the arrival of the next light pulse for a particular time and extending the output signal for the same time with zero values, we artificially increase the pulse repetition period. At the same time, we can obtain intermediate (additional) points of retinal AFC [7]. Essentially, the proposed and developed approach is similar to the well-known wavelet transform when using the Haar wavelet with the only difference that in the integrand product of the signal and wavelet, the added zero values belong not to the wavelet but to the signal itself [9].
Figure 5b shows the lengthening of the FERG processing period (10 Hz signal at the input) with zero values. In this case, the duration of such a period corresponds, as it were, to the input of light pulses with a pseudo frequency of 4.15 Hz. In Figure 6 presents the response of the retina of a healthy person with an artificial lengthening of the repetition period of the light pulses (pseudo-frequency pulse supply 1 Hz). Here are also marked with circles the points of the AFC of the same subject, obtained as a result of processing the initial FERG shown in Figure 5a. Note that the frequency response with an increase in the frequency of the supply of pulses gradually lower, that is, the transmission properties of the retina weaken.
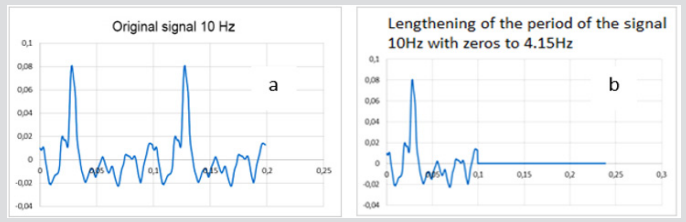
Figure 5: Shape of the FERG decomposed into a Fourier series: a - original 10 Hz; b - with a lengthening period with zeros to 4.15 Hz.
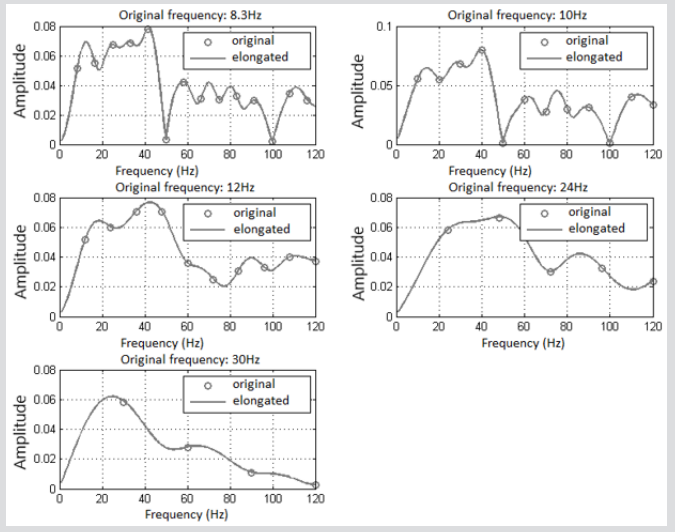
Figure 6: The family of the retinal responses with artificial lengthening of the repetition period of the light pulses (pseudofrequency pulse supply 1 Hz).
Knowing the frequency response of a healthy subject with normal vision, in this case, one can compare the frequency response of patients with retinal pathology. In Figure 7 shows the comparative frequency response of two eyes with suspected glaucoma (GL1), two eyes of one subject diagnosed with POAG Ia (Gl2) and two eyes of healthy control subjects - (norm N1 and N2). In this example, N1 includes data for a subject with normal refraction, and N2 - data for a person with mild myopia. All frequency responses are reduced to 4.15 Hz pseudo frequency. Retinal AFCs obtained reflect their properties to transform (strengthen or weaken) the corresponding amplitudes of the harmonics of the spectrum of the input signal.
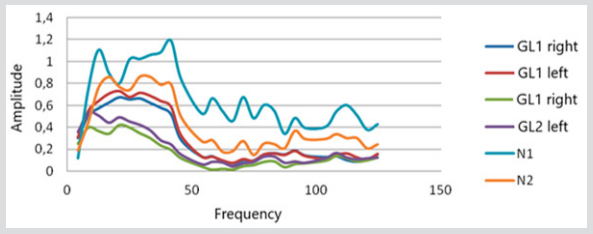
Figure 7: The family of the retinal AFC in norm and glaucoma (f = 8.3 Hz, pseudo frequency 4.15 Hz)
The selection of the amplitude of the input signal (A) of the response of the retina of a particular healthy subject from above is limited to a conventional unit or slightly exceeds it, as shown in Figure 7.
Approximation of Retinal AFC to Obtain Formalized Signs for the Diagnosis
The formalization of the signs extracted from the AFC of the retina was performed by approximation by algebraic power polynomials constructed by the frequency response. The argument of such polynomials was the frequency of the corresponding harmonics. The coefficients of these polynomials were taken into account as formalized signs characterizing FERG. Well-known numerical methods that are implemented in several famous mathematical packages are suitable for research in this direction. For research purposes, the Mathcad package was used.
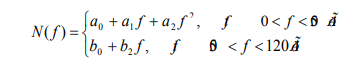
Attempting to approximate the retinal frequency response by a single power polynomial over the entire frequency range up to 120 Hz gives a highly smoothed curve, regardless of the degree of smoothing polynomial being assigned. Therefore, we have proposed to approximate the frequency response separately for the two frequency ranges. In the frequency range 0 <f <50 Hz, we approximate the frequency response with a second-order polynomial, and in the frequency interval 50 <f <120 Hz, we approximate the frequency response with a first-order polynomial. In this case, the harmonic with a frequency of 50 Hz is skipped. Thus, the approximating curve is presented in the form:
Consider this approximation of the frequency response for a subject with normal vision. The Figure 8 below shows its appearance at a stimulation frequency of 8.3 Hz (pseudo-frequency 4.15 Hz), as well as the result of approximation in the form of smoothed curves, constructed from the dependencies found (Figure 8).
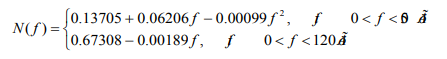
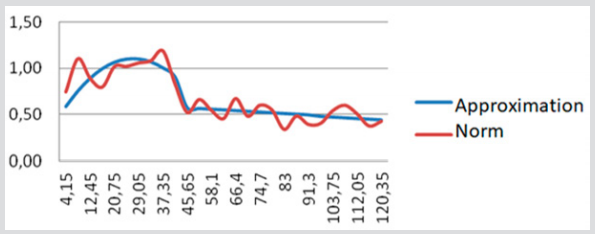
Figure 8: The combined original and smoothed frequency response.
Similarly, an approximation of retinal frequency response was performed for all standard stimulation frequencies. As a result of the approximation performed similarly, we obtain five numerical values of the coefficients of the approximating polynomials for each stimulation frequency, which are further used as new additional formalized signs for the diagnosis of retinal pathologies.
Pattern Stimulus Analysis
The simulating stimulus pattern signal graph in Figure 2b was explored on a mathematical model. Modeling demonstrates short dips of the light flux to zero, which alternate through every half period. It is due to the delay due to the clock frequency of the computer when the black and white cells of the pattern are reversed (field colors). Since in this case, according to (5), the amplitudes of the harmonics of the test stimulus in the frequency range of interest are practically constant and do not depend on their number in the decomposition of such a signal in a Fourier series is determined by the expression [5].
Thus, the frequency range for analyzing the spectrum of PERG, limited to 200 Hz, contains harmonics in the decomposition of the testing pulse almost all with the same amplitude. This conclusion is in good agreement with the results of the simulation of such an input signal in the Mat lab (Simulink) package. Therefore, the harmonics of the spectrum of the PERG decomposition into a Fourier series and the corresponding components of the retinal frequency response turn out to be proportional. In this case, the proportionality coefficient is determined by the amplitude of the first harmonic in the decomposition into a Fourier series of a testing pulse, the duration of which is determined by the clock frequency of the control computer. Note that increases by one order of magnitude the delay time when changing the color of the fields will increase by order of magnitude the amplitudes of the harmonics in the decomposition of the testing pulse. That is, it will increase its power and increase the amplitude of the retinal response. In this case, the “baseline” drift will be much less noticeable.
Baseline Drift Compensation PERG
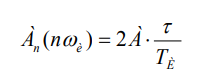
Figure 9 presents a record PERG of one period of the patient with glaucoma. A necessary condition for the successful decomposition of any periodic and continuous signal in a Fourier series is the coincidence of the values of this signal at the beginning and the end of the period. For the successful application of the artificial period extension with zero values, it is also necessary that these values be zero. PERG-response does not possess such properties. The graph clearly shows the baseline drift. For the correct application of the Fourier transform, we proposed a procedure for compensating the drift component, which consists of introducing corrections for the values of the drift component for each value of the digitized PERG. The baseline drift itself is represented as a straight line passing through the starting and ending points of the PERG period (Figure 9). Studies show that the linear representation of the baseline drift is in all cases reasonably accurate.
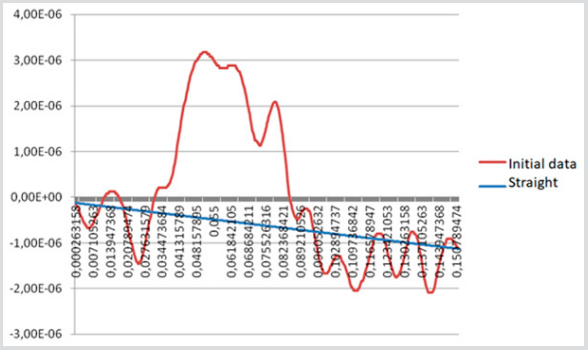
Figure 9: The original PERG time interval and linearized baseline drift.
Evaluation of Retina’s AFC by PERG
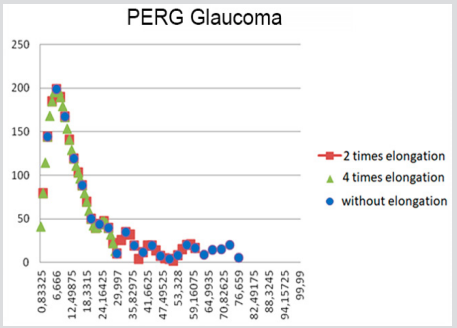
Figure 10: The PERG spectrum for the patient with glaucoma without lengthening and with artificial lengthening of the period with zero values.
Taking into account that all amplitudes of the harmonic of the test stimulus in the analyzed frequency range have equal values, the retinal frequency response with such a test is proportional to the estimated spectrum of the PERG with the compensated drift component of the baseline. Figure 10 shows the spectrum of a PERG in the patient with glaucoma, both without lengthening and artificially lengthening the period with zero values. When constructing the AFC of the retina from the available spectrum of corrected PERG, it is advisable to normalize the ordinate axis of a relatively healthy subject, just as it was done when building the AFC of the retina using FERG (Figure 10).
The simulation results and the analysis of digitized PERGs show that the values of the retina AFC estimates are proportional to the estimated amplitudes of the harmonics of the PERG spectrum with a ratio of 1: 480. An analysis of the retardation frequency response obtained by PERG shows that the size of the reversing chess pattern affects the numerical values, the type of curves, and the ratios between the calculated estimates. When obtaining formalized signs of retinal AFC by decomposition the PERGs into a Fourier series, it is advisable to approximate it in the same way as it was done with retinal AFC after the FERG processing.
Conclusion
The paper presents the following new results:
a) A method for constructing retinal AFC was developed taking into account the mathematical description of the used test incentives;
b) Proposed and tested the method of constructing the amplitude-frequency characteristics (AFC) of the retina, objectively reflecting its ability to convert the spectra of stimulating effects in the spectra of ERG;
c) A procedure for the polynomial approximation of retinal AFC is proposed, which allows using coefficients of approximating polynomials as new formalized features in diagnostics;
d) A negative component (baseline drift) was detected in the PERG of the examined patient, and a procedure for its compensation was proposed to exclude its influence on the results of retinal AFC evaluation.
e) It is shown that the response of the retina of healthy eyes and eyes with glaucoma have characteristic differences between them in the amplitude values of the harmonics at different frequencies of the frequency response, which can be used in the diagnosis;
f) Values of amplitudes of harmonics of the retina response are proportional to the estimated amplitudes of harmonics of the PERG spectrum with a ratio of approximately 1: 500, if the latter is not subjected to additional rationing;
g) The angular size of the reversing chess pattern affects the numerical values, the type of curves, and the relationship between the calculated frequency response estimates.
Acknowledgement
None.
Conflict of Interest
No conflict of interest.
References
- McCulloch DL, Marmor MF, Brigell MG, Hamilton R, Holder GE, et al. (2015) ISCEV Standard for full-field clinical electroretinography (2015 update). Doc. Ophthalmol 130(1): 1-12.
- Hood DC, Bach M, Brigell M, Keating D, Kondo M, et al. (2012) ISCEV standard for clinical multifocal electroretinography (mfERG) (2011 Edition). Doc. Ophthalmol 124(1): 1-13.
- Bach M, Brigell MG, Hawlina M, Holder GE, Johnson MA, et al. (2013) ISCEV standard for clinical pattern electroretinography (PERG): 2012 update. Doc. Ophthalmol 126(1): 1-7.
- (1967) Mathematics for electrical and radio engineers (with a foreword by Louis de Broglie). 2nd (edn.). Moscow: Science Russia, pp. 780.
- (1976) The theory of automatic control. In: Netushil AV (Eds.), Course book for universities. 2nd (edn.). supplemented and revised, High School, Moscow, Russia.
- Kolosov OS, Balarev DA, Pronin AD, Zueva MV, Tsapenko IV (2017) Evaluation of the frequency properties of a dynamic object using pulsed testing signals. Mechatronics, Automation, Management 18(4): 219-226.
- Kolosov OS, Korolenkova VA, Pronin AD, Zueva MV, Tsapenko IV (2018) Construction of the amplitude-frequency characteristics of the retina and the formalization of their parameters for use in diagnostic systems. Mechatronics, Automation, Management 19(7): 451-457.
- Sergienko AB (2013) Digital signal processing: studies. Tutorial. 3rd (edn.). SPb. BHV-Petersburg, Russia, pp. 768.
- Sviridov VG, Sviridov EV, Filaretov GF (2019) Fundamentals of automation of thermal physics experiment. Textbook for Universities. Publishing House MPEI, University in Moscow, Russia, pp. 336.
