 Research Article
Abstract
Objective: To investigate the characterization of breast lesions using diffusion kurtosis model-based imaging.
Methods: This prospective study included 120 consecutive patients underwent preoperative DCE-MRI examinations and multi-b-value diffusion-weighted imaging (DWI). 88 maligant lesions and 44 benign lesions were found and 56 normal fibroglandular breast tissue were selected as normal control. Conventional apparent diffusion coefficient (ADC) as well as DKI-based parameters mean kurtosis (MK) and mean diffusivity (MD) were analyzed by lesions types and histological subtypes using one-way ANOVA and receiver operating characteristic (ROC) curve.
Results:
a) The malignant group showed significantly lower ADC and MD (1.07±0.32 ×10⁻³ and 1.30±0.40 ×10⁻³ mm2/s, respectively) and higher MK(0.87±0.18)than the benign group(1.29±0.26 ×10⁻³, 1.62±0.31 ×10⁻³ mm2/s and 0.67±0.18,respectively) and normal control(1.67±0.33 ×10⁻³, 2.24±0.28 ×10⁻³ mm2/s and 0.52±0.08) (all P<0.001).
b) Area under the curve (AUC) for diagnosing malignant lesions was 0.936 for MD, 0.911 for MK and 0.897 for ADC. The AUC for MD was significantly higher than that for ADC(P=0.015).The optimal cut-off values, sensitivity, specificity, positive predictive value, negative predictive value and accuracy were as follow: ADC=1.18×103mm2/s,78.3%,93.2%,81.2%, 81.6%,81.4%;MD=1.48×103mm2/s, 82.2%, 98.3%, 84.4%, 87.8%, 86.2%; MK=0.78, 91.5%, 85.3%, 89.0%, 85.8%, 87.2%.
c) Invasive ductal carcinoma (IDC), ductal carcinoma in situ (DCIS) and mucinous adenocarcinoma showed significantly different ADC, MD and MK values (all P<0.05).
Conclusions: MR-DKI parameters enable to improve breast lesion characterization and have diagnostic potential in different pathological subtypes of breast cancers.
Key Points
a) Quantitative analysis of diffusion kurtosis imaging helps breast lesion characterization
b) Analysis of non-Gaussian distribution model is superior to Conventional ADC
c) MD can improve lesion differentiation showing the higher specificity and MK showing the higher sensitivity than ADC
d) DKI parameters have potential ability in differentiating pathological subtypes in breast cancer.
Keywords: Diffusion Weighted Imaging; Diffusion Kurtosis Imaging; Breast Lesions; Pathological Subtypes
Introduction
Breast cancer has become the most common form of tumors in women [1], and Dynamic contrast enhanced (DCE) magnetic resonance imaging (MRI) is an rather sensitive technique method for early detection and identification of benign and malignant breast lesions. However, diagnostic difficulty may exist in identification of benign and malignant breast lesions due to the overlap of time intensity curves of benign and malignant lesions. MR diffusion-weighted imaging (DWI) is of value in diagnosing of benign and malignant breast lesions, and its apparent diffusion coefficient (ADC) can improve the specificity of dynamic contrastenhanced (DCE) MRI in the diagnosis of malignant breast lesions [2-4]. However, there is also a substantial overlap in ADC values for benign and malignant lesions. The traditional DWI is based on the assumption that the diffusion of water molecules (random Brownian motion) within tissues is in accordance with a Gaussian distribution, whereas restrictions imposed by cell membranes, organelles, shrunked intercellular spaces due to cell proliferation and complex structures in tumor tissues result in the diffusion of water molecules deviating from a Gaussian distribution. Acknowledging this problem, Jensen et al. [5,6] introduced a diffusion kurtosis imaging (DKI) model which is an extension of Difussion Tenser Imaging (DTI) to quantitatively describe the displacement of water molecular diffusion that deviated from a Gaussian distribution. Mean kurtosis and mean diffusion coeffcients are calculated from this model.
Mean Kurtosis, which is a dimensionless metric, quantifies the deviation of water molecular diffusion from a Gaussian distribution and can potentially be sensitive to some tissue properties, such as heterogeneity [6]. Mean diffusivity is the diffusion co-effcient with correction of non-Gaussian bias. Researches have been conducted with DKI model on different organs such as brain [7-10], neck [11, 12], kidney [13,14], prostate [15, 16], and breast [17,18]. These studies showed DKI parameters are able to improve performance of differentiating malignant from benign lesions than traditional DWI and to allow differentiation among tumor grades such as cerebral glioma. Given that DKI provides information about diffusion that is closer to the actual state, its clinical utility might be superior to that of traditional DWI. However, studies of the accuracy of this model and the correlation between the DKI-derived parameters and different pathologic subtypes are lacking. Therefore, this present prospective study was designed to investigate the ability of DKI to differentiate between benign and malignant breast lesions, and to assess different pathological subtypes of breast cancer and different grades of invasive ductal carcinoma (IDC) [19].
Materials and Methods
Subjects
This prospective study was approved by the institutional ethics committee of xxx hospital and written informed consents were obtained from all patients. Consecutive patients with suspected breast disease who underwent preoperative DCE-MRI and multi-bvalue DWI from February 2016 to December 2017 were recruited. The major exclusion criteria were:
a) DWI image artifact might affect image observation and analysis
b) lesion showing low signal in DWI images and lesion with a diameter less than 8 mm
c) lesions showing line enhancement on DCE
d) breast biopsy, chemoradiotherapy or surgical treatment had been performed before MRI examination. The diagnosis of all lesions was confirmed by surgical pathology. The final sample included 120 individuals (1 male, 119 females) aged 22–82 years (average age, 46.7 ± 15.9 years).Surgical pathology confirmed 39 benign cases (3 cases had 2 ipsilateral lesions, and 1 case had 3 bilateral lesions) with 44 lesions (17 with fibroadenoma, 4 with intraductal papilloma, 10 with mastopathy and 13 with acute or chronic granulomatous inflammation) and 81 malignant cases (6 cases had 2 ipsilateral lesions, and 1 case had 2 bilateral lesions) with 88 lesions (59 cases of IDC, 16 cases of ductal carcinoma in situ (DCIS), 4 cases of solid papillary carcinoma with invasion, 4 cases of mucinous carcinoma, 2 cases of borderline phyllodes tumor, 1 case of invasive lobular carcinoma, 1 case of lymphoma and 1 case of metastatic tumor). 56 cases of normal contralateral tissue were randomly selected as control group.
MRI Examination
MRI examinations were performed in a prone position on a 1.5T MRI system (Aera, Siemens, Germany) with a dedicated fourchannel bilateral breast coil in the axial orientation. The scanning protocol was as follows:
i. A routine scan was performed using a fat-suppressed T2WI sequence (repetition time [TR]= 5600 ms; echo time [TE]= 65 ms; inversion time [TI]= 170 ms) and a three-dimensional fast low angle shot imaging (FLASH-3D) T1WI sequence (TR= 8.7 ms; TE= 4.76 ms; layer thickness= 4 mm; flip angle [FA]= 20º).
ii. Conventional DWI was performed using a single shot echo planar imaging (EPI) sequence with short time inversion recovery (STIR) as the fat-suppression (b values of 50 and 1000 s/mm2; TR= 4200 ms; TE= 65 ms; layer thickness= 4 mm; interval=1 mm; matrix= 192×144).
iii. DKI was performed using an EPI sequence with STIR (5 b-values of 0, 600, 1200, 1800 and 2400 s/mm2; TR=6200 ms; TE= 100 ms; layer thickness= 4 mm; layer spacing= 4.8 mm; matrix= 192×72; number of excitations (NEX)= 3 times). The generalized auto-calibrating partially parallel acquisition (GRAPPA) technique was adopted and the acceleration factor was 2.
iv. A dynamic enhanced scan was performed using a FLASH- 3D fat-suppressed T1WI sequence (TR= 4.55 ms; TE= 1.55 ms; layer thickness= 3 mm; no spacing; FA=10º; matrix= 336×448; scan time= 30 s; number of scans= 9), and the contrast agent was injected at the end of the first scan. Gadolinium-diethylene triamine pentacetate (Gd-DTPA; Consun Pharmaceutical Group Limited, Guangzhou, China) was used as the contrast agent (0.2 mmol/kg body weight). Gd-DTPA was injected at a rate of 3 ml/s with a highpressure syringe and was followed by the injection of 10 mL saline at the same rate.
Image Analysis and Processing
Image analysis was performed by two radiologists with 5 years and 10 years experiences in breast imaging field. The DCE images were analyzed by using the Breast Imaging Reporting and Data System(BI-RADS) MR imaging lexicon and were taken as reference. ADC maps were automatically generated from conventional monoexponential model with b values of 50 and 1000 s/mm2. The multib- value DWI datasets were imported into in-house developed software program developed in MATLAB software and pseudo-color parametric maps of mean kurtosis (MK), mean diffusivity (MD) and mean DWI parametric maps were calculated. A ROI was manually set on the mean DWI image including as much of the parenchymal part of the lesion as possible and avoid areas of necrosis, vessels and dominant ducts as well as interference from surrounding normal tissue or adipose tissue. The ROI was then synchronously copied to the ADC, MK and MD maps. The parameter values were recorded and means of 3 measurements were obtained. The mean ROI area was 67 mm2 (range, 15–206 mm2). Values for each parameter of normal contralateral gland tissue without enhancement or with low intensity on enhanced images were also measured. As much of the glandular tissue was included as possible, and gland edges, vessels and dominant ducts were avoided. The average ROI area was 115 mm2 (range, 60–200 mm2), and mean values were acquired from 3 measurements made in the same layer.Pathology
In order to ensure that the area measured in the MRI images was consistent with the area examined postoperatively in pathological sections, the upper, lower and inner edges of the lesion were labeled during surgery, and the tumor was completely resected. According to the lesion location in the body, the lesion specimens in vitro were stereo-positioned based on the intraoperative labels, and transverse pathological sections were obtained. The size, pathological type and histological grade of the tumor were recorded. Semi-quantitative evaluation and classification were performed using the histological grading system described by Elston and Ellis [6]. Glandular formation, nuclear polymorphism and mitotic count were each scored I to III, and the grade was determined from the overall score: grade I, 3-5; grade II, 6-7; and grade III, 8-9.
Statistical Analysis
SPSS 19.0 (IBM Corp., Armonk, NY, USA) was used for the statistical analysis. Measurement data are presented as means ± standard deviations (SDs) and were assessed for single sample Levene normality and homogeneity of variance. One-way analysis of variance (ANOVA) was used to compare ADC, MD and MK values between groups, and the least significant difference (LSD) test (homogeneity of variance) or Dunnett T3 method (heterogeneity of variance) was used for post-hoc pairwise comparisons. The correlation of MK with MD and ADC was assessed by Pearson correlation analysis. SigmaPlot (SyStat Software, San Jose, CA, USA) was used to construct receiver operating characteristic (ROC) curves, and the areas under the curves (AUC) were analyzed using the Delong statistical method [20] in order to compare the diagnostic efficacies of these parameters for the diagnosis of malignant breast lesions. The optimal diagnostic cut-off value for each parameter was determined according to the Youden index, and the corresponding sensitivity, specificity, positive predictive value, negative predictive value and accuracy were obtained for the diagnosis of malignant breast lesions. One-way ANOVA was used to compare each parameter between different histological types of breast cancer and between different grades of IDC. P < 0.05 was regarded as statistically significant difference.
Results
Comparison of Each Parameter Between Normal, Benign and Malignant Groups
There were significant differences in ADC, MK and MD values between normal, benign and malignant groups (P < 0.001). In pairwise comparisons, ADC and MD were significantly lower in the malignant group than in the benign and normal groups, whereas MK was significantly higher in the malignant group than in the benign and normal groups (Table 1 and Figures 1–3). The MK value was highly negatively correlated with MD and ADC (r values of -0.895 and -0.835, respectively; P < 0.01; Figures 4 and 5).

Table 1: Comparisons of ADC, MK and MD between malignant, benign lesions and normal tissue.
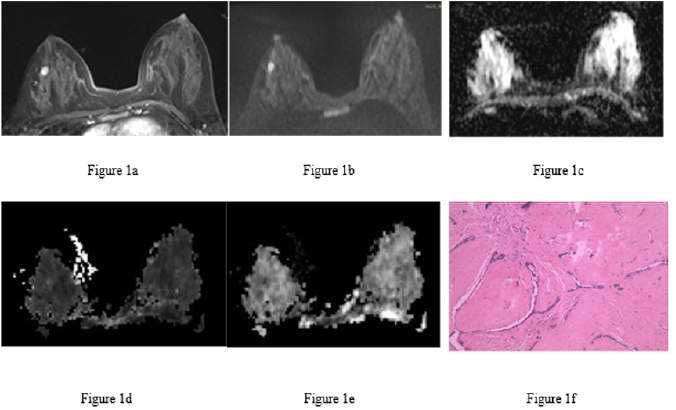
Figure 1: Fibroadenoma of the right breast in the same patient.
a) Image at the early dynamic enhanced stage. There was enhancement of the lesion (hyperintensity).
b) DWI image. The lesion was hyperintense.
c) ADC image. The lesion had a homogenous slightly low signal (ADC = 1.22×10⁻³ mm2/s).
d) MK image. The lesion had a homogenous signal (MK = 0.68).
e) MD image. The lesion had a homogenous, slightly low signal (MD = 1.53×10⁻³ mm2/s).
f) Pathological image routinely stained with hematoxylin-eosin (×100), showing mammary glands, ductal hyperplasia and surrounding fibrous tissue hyperplasia.

Figure 2: Invasive ductal carcinoma of the left breast in the same patient.
a) Image at the early dynamic enhanced phase showing heterogeneous, annular enhancement of the lesion without enhancement of the central necrotic area.
b) DWI image. The lesion had a heterogeneous, annular high signal with a slightly higher signal in the center. (c) ADC image. The lesion had an annular low signal with a high signal in the center (ADC = 1.30×10⁻³ mm2/s when the central area with a high signal was eliminated from the ROI).
c) MK image. The lesion had a heterogeneous, slightly high signal with hypointensity in a small area in the center (MK = 0.96 in the solid part).
d) MD image. The lesion had a heterogeneous, low signal with a small necrotic area with a high signal (MD = 1.28×10⁻³ mm2/s in the solid part).
e) Pathological image routinely stained with hematoxylin-eosin (×100) showing invasive growth of the cancer tissue, glandular-like and dense nest-like structures, nuclear hyperchromatism and atypia in cancer cells, and surrounding fibrous tissue hyperplasia.
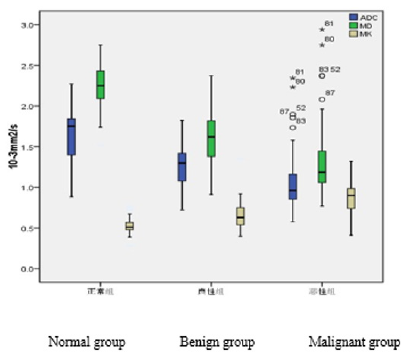
Figure 3: Compound box plot showing the distributions of the ADC, MD and MK values in the three groups. ADC and MD decreased from the normal to benign to malignant group, while MK increased. The differences were statistically significant (P < 0.001).

Figure 4: Scatter plot showing the correlation between MK and ADC (r = -0.835).
Figure 4: Scatter plot showing the correlation between MK and MD (r = -0.895).
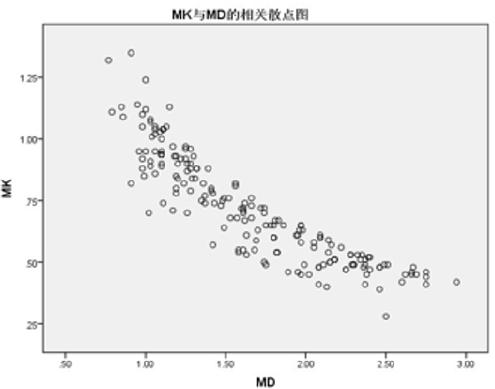
Figure 5:
The Diagnostic Efficacy of Each Parameter for The Diagnosis of Malignant Breast Lesions
The AUC for diagnosing malignant breast lesions was 0.936 for MD, 0.911 for MK and 0.897 for ADC (Figure 6); the only significant difference was for MD vs. ADC (P = 0.015). The sensitivity, specificity, positive predictive value, negative predictive value and accuracy of each parameter for the diagnosis of malignant breast lesions were shown in Table 2.
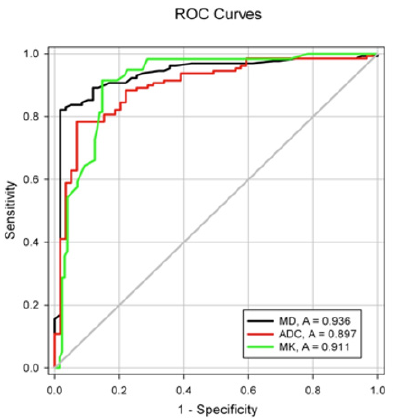
Figure 6: ROC curves for ADC, MD and MK in the diagnosis of malignant breast lesions.
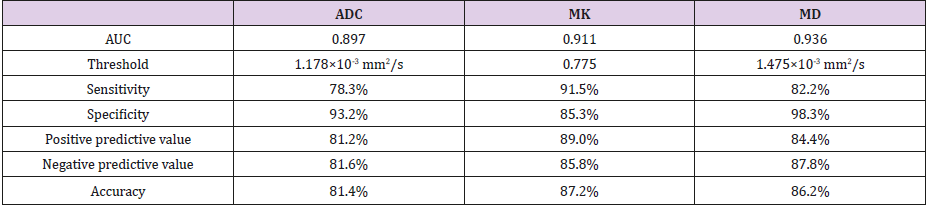
Table 2: Diagnostic efficacy of each parameter for the diagnosis of malignant breast lesions.
Comparison Of ADC, MD and MK Between Different Pathological Subtypes of Breast Cancer and Different Grades of IDC
ADC and MD value increased from IDC to DCIS to mucinous breast adenocarcinoma (MBC), while MK decreased (P < 0.05 for all pairwise comparisons; Table 3 and Figures 7-9). There were significant differences between IDC and solid papillary carcinoma of the breast (SPC) in MD (P = 0.001) but not ADC or MK. All three parameters differed significantly between SPC and MBC (ADC, P = 0.033; MD, P = 0.006; MK, P = 0.003), whereas none of the parameters differed between DCIS and SPC. Among the 53 cases of IDC for which histological grade had been determined, there were no cases of grade I, 13 cases of grade II and 40 cases of grade III. There were no significant differences between grade II IDC and grade III IDC in ADC (0.96 ± 0.17 vs. 0.94 ± 0.23 ×10⁻³ mm2/s), MD (1.14 ± 0.17 vs. 1.13 ± 0.24 ×10⁻³ mm2/s) or MK (0.94 ± 0.15 vs. 0.93 ± 0.13).
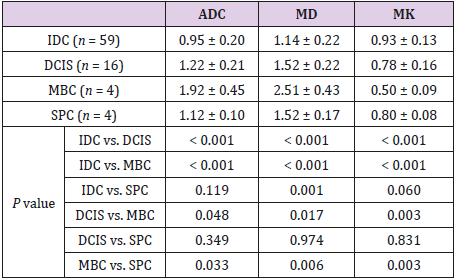
Table 3: Comparison of ADC, MD and MK values between different pathological types of breast cancer.
Note: Units for ADC and MD: ×10-3 mm2/s. Unit for MK: none. DCIS, ductal carcinoma in situ; IDC, invasive ductal carcinoma; MBC, mucinous breast adenocarcinoma; SPC, solid papillary carcinoma of the breast
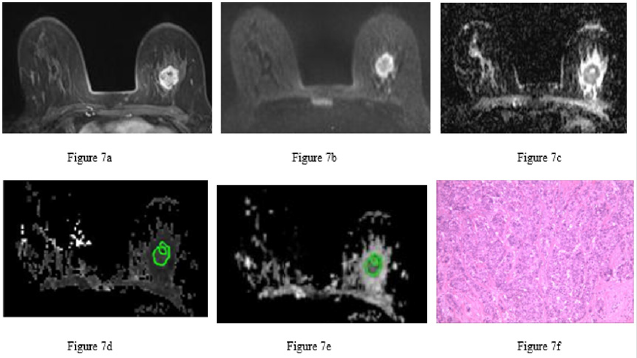
Figure 7: Invasive ductal carcinoma of the left breast in the same patient.
a) 7a Image at the early dynamic enhanced phase showing heterogeneous enhancement of the lesion without enhancement of the necrotic area.
b) 7b DWI image. The circular lesion had a heterogeneous, ring-like high signal with a relatively low signal in the center.
c) 7c ADC image. The left breast lesion had a heterogeneous, low signal with a high signal in some small areas (ADC = 1.10×10⁻³ mm2/s).
d) 7d MK image. The lesion had a heterogeneous, slightly high signal with a low signal in some small areas of necrosis (MK = 0.82 when the central necrotic area was eliminated from the ROI).
e) 7e MD image. The lesion had a heterogeneous, low signal with a high signal in a small necrotic area (MD = 1.36×10⁻³ mm2/s).
f) 7f Pathological image routinely stained with hematoxylin-eosin (×100) showing cancer cell infiltration, glandular and funicular structure, nuclear hyperchromatism and atypia of cancer cells, and surrounding fibrous tissue hyperplasia.
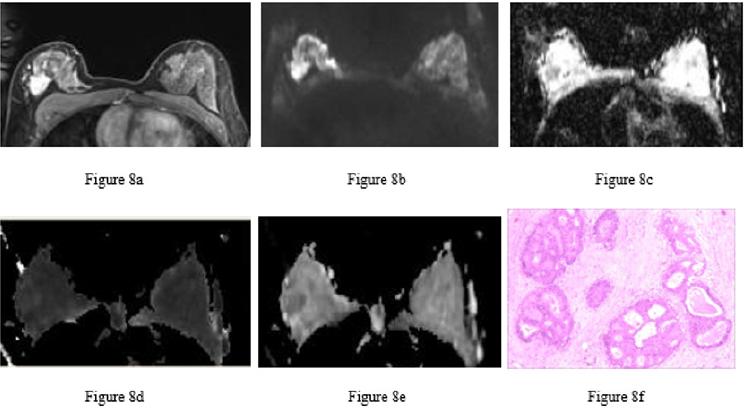
Figure 8: Ductal carcinoma in situ in the right breast of the same patient.
a) Image at the early dynamic enhanced phase showing heterogeneous enhancement of the lesion.
b) DWI image. The lesion had a heterogeneous, slightly high signal.
c) ADC image. The right breast lesion had a heterogeneous, low signal (ADC = 1.26×10⁻³ mm2/s).
d) MK image. The lesion had an even and slightly high signal (MK = 0.68).
e) MD image. The lesion had a heterogeneous, low signal (MD = 1.66×10⁻³ mm2/s).
f) Pathological image routinely stained with hematoxylin-eosin (×100) showing intraductal carcinoma tissue, cell aggregation, the formation of sieve-like structures and necrotic tissue in some ducts.

Figure 9: Mucinous adenocarcinoma of the right breast in the same patient.
a) T2WI showing that the lesion was orbicular-ovate with a smooth edge and a hyperintense signal.
b) Image at the early dynamic enhanced stage. The lesion was heterogeneously enhanced.
c) Image at the late dynamic enhanced stage. The lesion was persistently enhanced with an unenhanced division within it.
d) DWI image. The lesion had a high signal.
e) ADC image showing the high signal of the lesion (ADC = 2.23×10⁻³ mm2/s).
f) MK image. The lesion had a low signal (MK = 0.44).
g) MD image. The lesion was hyperintense (MD = 2.75×10⁻³ mm2/s).
h) Pathological image routinely stained with hematoxylin-eosin (×100) showing invasive growth of tumor tissue, a large mucous lake, a floating heterotypic cell mass on the mucous lake, adenoid-like structure in some regions, nuclear hyperchromatism and atypical heterocysts, and surrounding fibrous tissue hyperplasia.
Discussion
The malignant lesions possess lower MD value and higher MK value than benign lesions and normal tissues, which are consistent with the results of Nogueira et al. and Sun et al. [18,21]. An increase in the cell density of the tissue within the voxel caused by active mitosis and vigorous proliferation of malignant tumor cells and a decrease in extracellular space volume [22] would result in limitation of the motion of water molecules. Meanwhile, necrotic components and inflammatory cells in the extracellular space of a tumor would lead to an increase in the viscosity of intercellular fluid resulting in further restriction of water diffusion [23]. Compared to benign lesions, higher MK value in malignant lesions means that complex voxel microstructure in heterogeneous breast cancers results in a more heterogeneous diffusion distribution of water molecules and a larger deviation from a Gaussian distribution. These differences are consistent with expectations. However, the MD value obtained from the non-Gaussian model was higher than the ADC value, indicating that the ADC value obtained from a conventional mono-exponential model may not provide a complete description of the diffusion characteristics. Thus, differences in MK and MD between benign and malignant breast tumors may reflect microstructural differences between these lesion types, and this could potentially be exploited to allow their identification by analyzing MK and MD values.
We found that the diagnostic efficacy for malignant breast lesions was higher for DKI model than for ADC and MK, which showed higher sensitivity and MD showed higher specificity. However, our results were different from those of Wu et al. [24]. Conventional mono-exponential model neglects heterogeneous diffusion distribution of water molecules in tissue resulting in great overlap in ADC values for benign and malignant lesions. However, the DKI model provides a quantitative description of the extent to which water molecule diffusion deviates from a Gaussian distribution, hence may reflect the complexity of the voxel microstructure, which is a more realistic reflection of the state of the body. This might explain why DKI model is superior to conventional DWI in diagnostic efficacy. The MD value was higher than ADC value in our study and sensitivity and specificity of MD were higher than ADC, which suggests that some important information may be implied by MD. Wu et al. [24] reported that the sensitivity and specificity of MK for distinguishing between benign and malignant breast lesions was higher than that of MD, and the misdiagnosis rate was lower. Nevertheless, the results of our study showed that the AUC of MD (0.936) in the diagnosis of malignant breast lesions was numerically (but not significantly) higher than that of MK (0.911) and significantly higher than that of ADC (0.897). The specificity of MD was very high (98.3%), and the sensitivity, positive predictive value, negative predictive value and accuracy of MD were higher than those of ADC. These results suggest that DKI may provide more valuable information than conventional DWI with regard to microstructural changes. Thus, both MK and MD values may have important clinical utility in the differential diagnosis of benign and malignant breast lesions. The MK value had higher sensitivity, while the MD value had higher specificity, which would improve the differentiation of these lesions.
The findings of our study demonstrated that the MD value increased successively from IDC to DCIS to MBC. Adversely, the MK value successively decreased. The differences between these pathological subtypes were significant. Previous studies showed that ADC value increased in turn from IDC to DCIS to MBC [25- 28], which MD value in our study is consistent with that. The carcinomatous ductal epithelium of DCIS is restricted in situ and does not break through the basement membrane, whereas IDC disrupts the basement membrane through proteolytic activity and extensively invades and spreads across the mesenchyme. On the other hand, proteolysis-induced chronic inflammatory infiltration promotes the proliferation of connective tissue and leads to a further decrease in the extracellular space and a higher density of cells [28]. As a result, ADC and MD are lower for IDC than for DCIS. The MK value for IDC is higher than DCIS. It suggests that DCIS and IDC could be identified preoperative according to the MD and MK values and provides clinician with decision reference to avoid overtreatment. MBC tumors contain a large amount of extracellular mucus components with a very low cell density [27,29] and have a simple tissue structure with low restriction of water molecule diffusion. Previous investigations have demonstrated that the ADC value was higher for MBC than for benign tumors and other malignant tumors [27]. This study showed that the performance characteristics of MD, an averaged diffusion co-efficient in each direction after calibration for a non-Gaussian distribution, were similar to those of ADC. The MD value of MBC was higher than that of IDC, DCIS and benign lesions, while the MK value was lower. SPC is an intraductal lesion, and there were no significant differences in all parameters between SPC and DCIS. SPC is characterized by a compact arrangement and expansive growth, is rich in cellular nodules, has a fibrovessel axis, and is often accompanied by mucinous carcinomas and/or neuroendocrine carcinomas [30, 31], making it heterogeneous. As a result, it is difficult to distinguish between SPC and IDC. Our study found that SPC and IDC showed no differences in ADC and MK but a significant difference in MD. This suggests that the MD value, which is based on the complexity of the biological tissue microstructure, may provide additional valuable information for breast lesions with similar ADC values.
This study revealed that there was no correlation between DKI-model parameters and histological grade of IDC, which is inconsistent with the results of Sun et al. [21]. Sun reported that the MK and MD values of grade III IDC were significantly different from those of grades I and II. Sun also suggested that the MK value was positively related to histological grade, and MD was negatively related to the histological grade of IDC. Although no cases of grade I in this group of randomly selected cases may result in analysis bias, grades I and II were integrated into lower grade group in Sun’s analysis. Thus, the results should be interpreted with caution. Studies [32,33] have shown that attenuation of the MR signal in highly perfused tissues results from the combined effects of water molecule diffusion and microvascular perfusion. Attenuation of the DW signal by microvascular perfusion is due to spin dephasing induced by false blood diffusion within the blood capillary of the voxel, with intravoxel incoherent motion. However, blood perfusion mainly exhibits false diffusion at low b-values, and because of this, higher b-values (600, 1200, 1800 and 2400 s/mm2) were used in this study to fit the attenuation of the DW signals for kurtosis imaging analysis so as to minimize the spurious diffusional effect of blood perfusion. Moreover, the scan time was only 70s, which is acceptable for most patients. Therefore, it would be feasible to apply this model of DKI to clinical practice.
The mammary glands gradually atrophy is replaced by adipose tissue with increasing age. Adipose tissues in mammary glands can produce a significantly lower diffusion co-efficient [34], and a poor effect of fat suppression might lead to overestimation of the MK value. Thus, Multi-b value DWI with STIR was performed in this study in order to acquire better fat-suppression uniformity. This study has some limitations which need to be pointed out. First, this study did not evaluate the effects of menopausal status and the menstrual cycle on the utility of DKI parameters for the assessment of breast tumor tissues. It has been reported that the ADC value of a tumor does not vary with different stages of the menstrual cycle but is significantly lower in postmenopausal women than in premenopausal women [35]. Second, different mammary gland types may have an influence on the DKI parameters, and the MD value of heterogeneous dense glands may be higher than that of glands containing more adipose tissue. In this study, the influence of gland type on DKI parameters in the normal breast group was also not evaluated.
In conclusion, the diagnostic efficacies of the DKI parameters, MK and MD, were higher than that of ADC obtained with a conventional mono-exponential model, hence the use of MK and MD could improve differentiation between malignant and benign breast lesions. MD and MK could also potentially be used in the differential diagnosis of IDC, DCIS, MBC, IDC and SPC.
Acknowledgment
This work was supported by the grant no. 81660435 and 81860468 from the National Natural Science Foundation of China.
References
- Ferlay J, Soerjomataram I, Dikshit R, Eser S, Mathers C, et al. (2015) Cancer incidence and mortality worldwide:Sources, methods and major patterns in GLOBOCAN 2012. Int J Cancer 136(5): 359-386.
- Fan L, Strasser-Weippl K, Li JJ, Jessica St Louis, Prof Dianne M Finkelstein, et al. (2014) Breast cancer in China. The Lancet Oncology. 15(7): e279-e289.
- Kuhl CK, Mielcareck P, Klaschik S, Leutner C, Wardelmann E, et al. (1999) Dynamic Breast MRI Imaging:Are Signal Intensity Time Course Data Useful for Differential Diagnosis of Enhancing Lesions ? Radiology. 211(1): 101-110.
- Neubauer H, LI M, Kuehne-heid R, Schneider A, Kaiser WA, et al. (2003) High grade and non-highgrade ductal carcinoma in situ on dynamic MR mammography: characteristic findings for signal increase and morphological pattern of enhancement. The British Journal of Radiology 76(901): 3-12.
- Jensen JH, Helpern JA, Ramani A (2005) Diffusional Kurtosis Imaging: The Quantification of Non-Gaussian Water Diffusion by Means of Magnetic Resonance Imaging. Magn Reson Med 53(6): 1432-1440.
- Jensen JH, Helpern JA (2010) MRI quantification of non-Gaussian water diffusion by kurtosis analysis. NMR Biomed23(7): 698-710.
- Wu Y, Kim J, Chan ST, Zhou IY1, Guo Y, et al. (2016) Comparison of image sensitivity between conventional tensor-based and fast diffusion kurtosis imaging protocols in a rodent model of acute ischemic stroke. NMR Biomed 29(5): 625-630.
- Steven AJ, Zhuo J, Melhem ER (2014) Diffusion kurtosis imaging: an emerging technique for evaluating the microstructural environment of the brain. AJR Am J Roentgenol 202(1): W26-33.
- Grinberg F, Maximov, II, Farrher E, Neuner I, Amort L, et al. (2017) Diffusion kurtosis metrics as biomarkers of microstructural development: A comparative study of a group of children and a group of adults. Neuroimage 144(Pt A): 12-22.
- Blockx I, Verhoye M, Van Audekerke J, Bergwerf I, Kane JX, et al. (2012) Identification and characterization of Huntington related pathology: an in vivo DKI imaging study. Neuroimage 63(2): 653-662.
- Jansen JF, Stambuk HE, Koutcher JA (2010) Non-gaussian analysis of diffusion-weighted MR imaging in head and neck squamous cell carcinoma: A feasibility study. AJNR Am J Neuroradiol 31(4): 741-748.
- Yuan J, Yeung DK, Mok GS, Bhatia KS, Wang YX, et al. (2014) Non- Gaussian analysis of diffusion weighted imaging in head and neck at 3T: a pilot study in patients with nasopharyngeal carcinoma. PLoS One 9(1): e87024.
- Pentang G, Lanzman RS, Heusch P, Müller-Lutz A, Blondin D, et al. (2014) Diffusion kurtosis imaging of the human kidney: a feasibility study. Magn Reson Imaging 32(5): 413-420.
- Dai Y, Yao Q, Wu G, Wu D, Wu L, et al. (2016) Characterization of clear cell renal cell carcinoma with diffusion kurtosis imaging: correlation between diffusion kurtosis parameters and tumor cellularity. NMR Biomed 29(7): 873-881.
- Tamura C, Shinmoto H, Soga S, Okamura T, Sato H, et al. (2014) Diffusion kurtosis imaging study of prostate cancer: preliminary findings. J Magn Reson Imaging 40(3): 723-729.
- Quentin M, Pentang G, Schimmoller L, Kott O, Müller-Lutz A, et al. (2014) Feasibility of diffusional kurtosis tensor imaging in prostate MRI for the assessment of prostate cancer: preliminary results. Magn Reson Imaging 32(7): 880-885.
- Iima M, Yano K, Kataoka M, Umehana M, Murata K, et al. (2015) Quantitative Non-Gaussian Diffusion and Intravoxel Incoherent Motion Magnetic Resonance Imaging: Differentiation of Malignant and Benign Breast Lesions. Invest Radiol 50(4): 205-211.
- Nogueira L, Brandao S, Matos E, Nunes RG, Loureiro J, et al. (2014) Application of the diffusion kurtosis model for the study of breast lesions. Eur Radiol 24(6): 1197-1203.
- Gradishar WJ, Anderson BO, Balassanian R, Blair SL, Burstein HJ, et al. (2018) Breast Cancer, Version 4.2017, NCCN Clinical Practice Guidelines in Oncology. J Natl Compr Canc Netw 16(3): 310-320.
- DeLong ER, DeLong DM, Clarke-Pearson DL (1988) Comparing the areas under two or more correlated receiver operating characteristic curves: a nonparametric approach. Biometrics 44(3): 837-845.
- Sun K, Chen X, Chai W, Fei X, Fu C, et al. (2015) Breast Cancer: Diffusion Kurtosis MR Imaging--Diagnostic Accuracy and Correlation with Clinical-Pathologic Factors. Radiology 277(1): 46-55.
- Brandao AC, Lehman CD, Partridge SC (2013) Breast magnetic resonance imaging: diffusion-weighted imaging. Magn Reson Imaging Clin N Am 21(2): 321-336.
- Costantini M, Belli P, Rinaldi P, Bufi E, Giardina G, et al. (2010) Diffusionweighted imaging in breast cancer: relationship between apparent diffusion coefficient and tumour aggressiveness. Clin Radiol 65(12): 1005-1012.
- Wu D, Li G, Zhang J, Shixing Chang, Jiani Hu, et al. (2014) Characterization of Breast Tumors Using Diffusion Kurtosis Imaging (DKI). PLOS ONE.
- Mori N, Ota H, Mugikura S, Takasawa C, Tominaga J, et al. (2013) Detection of invasive components in cases of breast ductal carcinoma in situ on biopsy by using apparent diffusion coefficient MR parameters. Eur Radiol 23(10): 2705-2712.
- Hussein H, Chung C, Moshonov H, Miller N, Kulkarni SR, et al. (2015) Evaluation of Apparent Diffusion Coefficient to Predict Grade, Microinvasion, and Invasion in Ductal Carcinoma In Situ of the Breast. Acad Radiol 22(12): 1483-1488.
- Zhang L, Jia N, Han L, Yang L, Xu W, et al. (2015) Comparative analysis of imaging and pathology features of mucinous carcinoma of the breast. Clin Breast Cancer 15(2): e147-154.
- Bickel H, Pinker-Domenig K, Bogner W, Spick C, Bagó-Horváth Z, et al. (2015) Quantitative apparent diffusion coefficient as a noninvasive imaging biomarker for the differentiation of invasive breast cancer and ductal carcinoma in situ. Invest Radiol 50(2): 95-100.
- Yoo JL, Woo OH, Kim YK, Cho KR, Yong HS, et al. (2010) Can MR Imaging contribute in characterizing well-circumscribed breast carcinomas? Radiographics 30(6): 1689-1702.
- Saremian J, Rosa M (2012) Solid papillary carcinoma of the breast: a pathologically and clinically distinct breast tumor. Arch Pathol Lab Med 136(10): 1308-1311.
- Guo S, Wang Y, Rohr J, Fan C, Li Q, et al. (2016) Solid papillary carcinoma of the breast: A special entity needs to be distinguished from conventional invasive carcinoma avoiding over-treatment. Breast 26: 67-72.
- Bokacheva L, Kaplan JB, Giri DD, Patil S, Gnanasigamani M, et al. (2014) Intravoxel incoherent motion diffusion-weighted MRI at 3.0 T differentiates malignant breast lesions from benign lesions and breast parenchyma. J Magn Reson Imaging 40(4): 813-823.
- Liu C, Liang C, Liu Z, Zhang S, Huang B, et al. (2013) Intravoxel incoherent motion (IVIM) in evaluation of breast lesions: comparison with conventional DWI. Eur J Radiol 82(12): e782-789.
- Nogueira L, Brandão S, Nunes RG, Ferreira HA, Loureiro J, et al. (2015) Breast DWI at 3 T: influence of the fat-suppression technique on image quality and diagnostic performance. Clinical Radiology 70(3): 286-294.
- Shin S, Ko ES, Kim RB, Han BK, Nam SJ, et al. (2015) Effect of menstrual cycle and menopausal status on apparent diffusion coefficient values and detectability of invasive ductal carcinoma on diffusion-weighted MRI. Breast Cancer Res Treat 149(3): 751-759.
