 Research Article
Abstract
Functional organic analog of zeolite (FOAZ) was used as the matrix for laser desorption ionization mass spectrometry and applied to the measurement of nicotine and cotinine in mouth cavity after smoking. In the diffuse reflectance spectrum, FOAZ produced a strong absorption at 337 nm, whereas diphenyl anthracene (DA), the basic structural moiety of FOAZ, gave a weak absorption. FOAZ crystals had parallelogram structures and many water molecules as adsorbate. It was revealed that FOAZ could be an electron donor and a proton donor, and its potential as a matrix in matrix-assisted laser desorption ionization mass spectrometry (MALDI MS) was investigated by measuring stearic acid, nicotine, and cotinine in the negative and positive ion modes. FOAZ realized high reproducibility of analyte ion intensity with the relative standard deviation of 4.82%. Then, FOAZ was applied to the direct measurement of nicotine and cotinine in mouth cavity after smoking. Because of the high reproducibility of analyte ion intensity, metabolic dynamics from nicotine to cotinine was investigated. Measurements of saliva in mouth cavity revealed that nicotine was metabolized to cotinine with the time constant of 71.4 min.
Abbreviations: FAOZ: Functional Organic Analog Of Zeolite; DA: Diphenyl Anthracene; MALDI MS: Matrix-Assisted Laser Desorption Ionization Mass Spectrometry; LC-MS: Liquid Chromatography-Mass Spectrometry; HPLC: High-Performance Liquid Chromatography; APCI: Atmospheric Pressure Chemical Ionization; TG-DTA: Thermogravimetry-Differential Thermal Analysis; SEM: Scanning Electron Microscope; EI: Electron Ionization; RSDs: Relative Standard Deviations; Nic: Nicotine; Cot: Cotinine
Introduction
Tobacco smoking is practiced worldwide. The dried leaves of tobacco plant, Nicotiana tabacum, are lit and the resulting smoke is inhaled and absorbed by the human body via lungs. Nicotine, a substance in smoke, acts on the nicotine receptor in the brain, and such hormones as dopamine and endorphins [1], which are associated with pleasure, are released. For this reason, nicotine causes strong dependence like other stimulants, including cocaine and heroin. In addition, it is widely known that tobacco smoking causes cancer in not only the lungs but also other organs [2]. Smoking also causes diseases of the circulatory and respiratory organs. As many substances in tobacco smoke are harmful to the human body, the effects of passive smoking have gained recognition as a social problem [2]. In order to diagnose the effects of nicotine, it is important to accurately determine nicotine levels in the human body. Several reports on the mass spectrometric analysis of nicotine and its metabolites are available [3-12].
Nicotine and its metabolites in biological fluids, such as urine, saliva, plasma, and serum, have been analyzed by using various ionization techniques with accompanying chromatographic separation. For example, Meger et al. used liquid chromatographymass spectrometry (LC-MS) with atmospheric pressure chemical ionization (APCI) to detect nicotine and its metabolites in urine of smokers [13]. Moyer et al. reported a simultaneous analysis of nicotine and its metabolites in serum and urine by high-performance liquid chromatography (HPLC) - tandem mass spectrometry [14]. Kataoka et al. reported nicotine detection from urine and saliva by using LC-MS with solid-phase microextraction [15]. As examples of nicotine detection by matrix-assisted laser desorption ionization mass spectrometry (MALDI MS), Xie et al. reported nicotine determination in smoke on the single puff level using liquid-phase microextraction [16]. Benton et al. achieved a direct detection of nicotine and cotinine in fingermarks by using silica particles [17]. Nakanishi et al. reported a quantitative and imaging analysis of nicotine in a single strand of hair from smokers [18].
In this report, time-dependent changes of nicotine and cotinine in mouth cavity after smoking were investigated by MALDI MS using a functional organic analog of zeolite (FOAZ) as the matrix. FOAZ is the organic analog of zeolite; 9,10-bis(3,5-dihydroxy-1- phenyl)anthracene (BDA) molecules (Figure 1a) are assembled by forming hydrogen bonds, and supramolecular cavities are produced in molecular crystals [19] (Figure 1b). First, the physicochemical properties of FOAZ were investigated, and the potential of FOAZ as a matrix for MALDI MS was evaluated. It was found that FOAZ could be used as a matrix for MALDI MS by acting as an electron donor and a proton donor to an analyte. Second, FOAZ was applied to the direct measurement of nicotine and cotinine in mouth cavity after smoking. Because of the high reproducibility of analyte ion intensity, the metabolic dynamics from nicotine to cotinine was monitored by MALDI MS. Nicotine was metabolized to cotinine with the time constant of 71.4 min, and this value was in agreement with previous data.
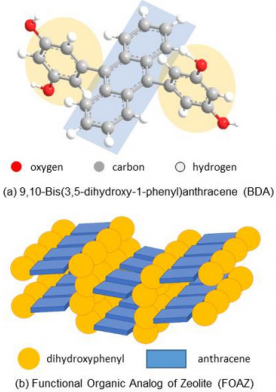
Figure 1: Schematic diagrams of
(a) 9,10-bis(3,5-dihydroxy-1-phenyl)anthracene (BDA) and
(b) functional organic analog of zeolite (FOAZ).
Experimental
9,10-Bis(3,5-dihydroxy-1-phenyl)anthracene (BDA) was dissolved in distilled water, and the solvent was evaporated to obtain the functional organic analog of zeolite (FOAZ). FOAZ, 9,10-diphenylanthracene (DA), and anthracene (4 mg) were dissolved in a mixture of acetonitrile and water (v/v = 7:3, 1 mL). One milligram of analyte (stearic acid, nicotine, and cotinine) was dissolved in another mixture of acetonitrile and water (v/v = 7:3, 1 mL). One microliter each of matrix (FOAZ, DA, or anthracene) and analyte solutions was pipetted onto a stainless-steel plate, and the solvent was evaporated to obtain the crystals. Measurements were carried out with a commercial system (autoflex-05, Bruker; 337 nm, 21 μJ) in the positive and negative ion regions. Mass spectra were obtained by averaging 200 laser shots at random sample spots. Thermogravimetry-differential thermal analysis (TG-DTA) measurements (Rigaku) were carried out from RT to 500 °C at the heating rate of 10 °C min−1. α-Al2 O3 was used as reference. Scanning electron microscope (SEM) images were taken using a commercial apparatus (SU6600, Hitachi). Sample solution was dropped onto a silicon wafer. After the evaporation of the solvent, the obtained crystals were subjected to SEM measurements. Measurements of nicotine and cotinine in mouse cavity were carried out as follows: A man in his twenties stopped smoking for three days prior to the measurements. Saliva before and after smoking (one cigarette with tar and nicotine indications of 5 mg and 0.3 mg, respectively) was collected with a cotton swab, and the cotton swab was pressed against a stainless sample plate. Saliva was collected 5 minutes before smoking, immediately after smoking, and 1, 2, 3, and 4 hours thereafter. After the saliva collection, one microliter of FOAZ solution (matrix) was dropped onto the sample. After the solvent evaporation, the obtained crystals were subjected to MALDI MS with the laser power of 58.5 μJ.
Results and Discussion
Functional Organic Analog of Zeolite (FOAZ)
Figure 2a shows the diffuse reflectance spectrum of FOAZ. The spectrum of DA is shown by a dotted line for comparison. The spectral feature of DA was different from that of FOAZ although DA is the basic structural moiety of FOAZ. Hydroxyl groups that form hydrogen bonds between DAs were missing, and therefore, DAs could not form large clusters by forming hydrogen bonds. FOAZ produced an absorption in the UV-vis region that includes 337 nm (excitation wavelength for mass spectrometry). In contrast, the absorption of DA at 337 nm was very weak. Differences were also found in the SEM images of FOAZ and DA crystals, as shown in Figures 2b & 2c. Figure 2b shows crystals with parallelogram structures, suggesting that BDA molecules regularly assemble to form FOAZ. In contrast, only irregular small crystals were found in DA (Figure 2c). The difference between FOAZ and DA was also examined by TG-DTA measurements, and the results are shown in Figure 3. The TG-DTA curve of inorganic zeolite (aluminosilicate; HY5.6) is shown for comparison. The TG curves in the temperature range of 25 to 120 °C revealed that the weight of FOAZ decreased very rapidly whereas the weight of DA remained constant; weight loss at 100 °C was 48% for FOAZ and 0% for DA.
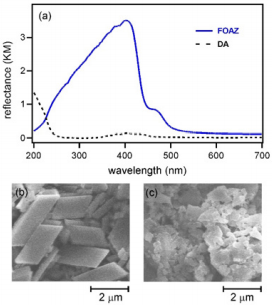
Figure 2:
(a) Diffuse reflectance spectra of FOAZ and diphenylanthracene (DA).
(b) SEM images of (b) FOAZ and (c) DA.
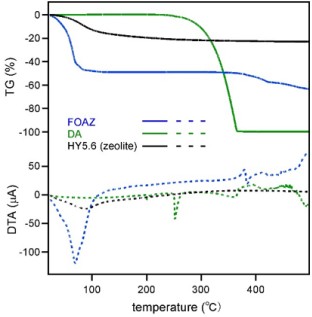
Figure 3: TG-DTA curves of FOAZ and DA. The TG-DTA curves of HY5.6, an inorganic zeolite, are shown for comparison.
In addition, the weight loss in the TG curve of FOAZ was accompanied by an endothermic peak around 70 °C in the DTA curve. As the desorption of molecules from the surface is an endothermic reaction, the weight loss in the TG curve was attributable to the desorption of water molecules. This situation was also observed for zeolite; the 12.9% weight loss was accompanied by an endothermic peak around 85 °C, which was caused by the desorption of water molecules. As BDA molecules were regularly assembled by hydrogen bonds to form a three-dimensional and microporous structure like zeolite, FOAZ had abundant free space for the adsorption of water molecules. Besides, it was found that FOAZ began combustion at temperatures higher than 300 °C, whereas vaporization was considered for DA as its weight markedly decreased. In the case of zeolite, neither combustion nor vaporization was observed because zeolite is an inorganic material. Figure 4a shows the laser desorption ionization mass spectrum of FOAZ (without analyte) in the negative ion region. The mass region from m/z = 380 to 410 is enlarged in the inset. The peak of deprotonated BDA, [BDA-H]- , was mainly observed at m/z = 393, and was probably produced by the deprotonation of a hydroxyl group in BDA.
In addition, peaks of isotope species were observed at m/z = 394 and 395. In the positive ion region shown in Figure 4b, on the other hand, the peak of BDA cation, [BDA]+ , was observed at m/z = 394 with a strong intensity. Although a peak whose m/z value was the same as the protonated BDA ([BDA+H]+ ) m/z value was observed at m/z = 395, proton adduction to the BDA molecule seemed difficult judging from the molecular structure shown in Figure 1a. Therefore, the peaks at m/z = 395 as well as the small peak at m/z = 396 were considered to be due to the isotopes of [BDA]+ . Figure 4b revealed that electrons were ejected from FOAZ after the photoexcitation. Therefore, FOAZ could be a matrix with electron-donating ability, and the electrons could be used as the ionization source as in the case of electron ionization (EI) MS. In the next section, the possibility of using FOAZ as a matrix for laser desorption ionization mass spectrometry was explored in both negative and positive ion regions.
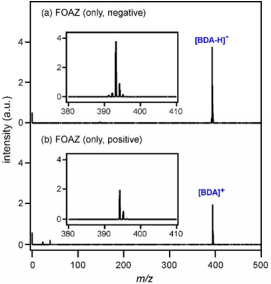
Figure 4: Laser desorption ionization mass spectra of FOAZ (only) in the
(a) negative and
(b) positive ion modes. Mass region from m/z = 380 to 420 is enlarged in the insets.
Negative Ion Production
In our previous work where we used semiconductor nanoparticles as the electron donor, we found that the donated electrons could react with a compound containing carboxyl groups to generate deprotonated species [20, 21]. Therefore, we assumed that FOAZ could be used as a matrix for generating negative ions of compounds containing carboxyl groups. Figure 5a shows the mass spectrum of stearic acid (Ste) measured with FOAZ as the matrix. Ste contains a carboxyl group and is ionized as follows.

Here, R represents other groups in Ste. In Figure 5a, the peak of [Ste-H]- was observed at m/z = 283. A strong peak of [BDA-H]- was observed at m/z = 393, and this mass region is almost devoid of noise peaks. In our previous research using inorganic zeolite, we found that zeolite prevented the fragmentation of adsorbed molecules, which in turn, simplified the mass spectrum. This was because zeolite acted as a heat bath that diffuses excess vibrational energies of both analyte and matrix molecules into lattice vibrational modes [22]. The same tendency was expected for FOAZ because of its periodic three-dimensional structures. As shown in Figure 5a, few fragment ions were produced, and the mass spectrum was simplified. This was probably because of the vibrational cooling effect of FOAZ, as in the case of zeolite. However, the situation changed when DA and anthracene (A) were used. Figure 5b shows the mass spectrum of Ste measured with DA as the matrix. Although the peak of [Ste-H]- was observed, as in Figure 5a, several unknown peaks were discernible. When anthracene was used as the matrix, several fragment peaks stood out. For anthracene and DA, both cooling effect and spectrum simplification were not achieved, and several unknown peaks were evident.
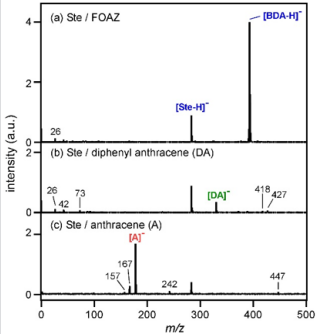
Figure 5: Mass spectra of stearic acid (Ste) measured with
(a) FOAZ,
(b) DA, and
(c) anthracene
(A) in the negative ion mode.
The peak intensities of [Ste-H]- and their standard deviations when FOAZ and DA were used as matrices are summarized in Table 1. Although the averages of the peak intensities were almost the same for FOAZ and DA, their relative standard deviations (RSDs) were markedly different; overall RSD was 4.82% for FOAZ and 40.2% for DA. It is widely known that the reproducibility of MALDI MS is quite low and therefore, quantitative analysis is difficult. The overall RSD of 40.2% for DA is common in conventional MALDI MS. However, the overall RSD of 4.82% is very small, indicating that high reproducibility was realized by using FOAZ. In our previous study using inorganic zeolite, the RSD value of analyte ion was also small (less than ~ 10%) as the analyte adsorption sites were well dispersed on the zeolite surface [21,23]. As FOAZ is the organic analog of zeolite, it was considered that the analyte adsorption sites were also well dispersed, which resulted in the high reproducibility of analyte ion intensity.
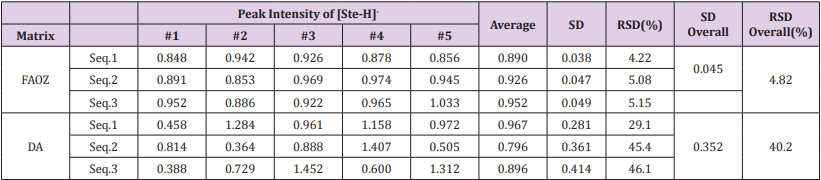
Table 1: Peak Intensity of [Ste-H]- and its standard deviation.
FOAZ was also examined as the matrix for positive ion measurements. The peak of deprotonated BDA in Figure 4a suggested that FOAZ could be a proton donor by photoexcitation. In conventional MALDI MS, residual solvent in the mixed crystals of matrix and analyte sometimes functions as a proton or alkali cation source for the ionization of analyte. From Figure 3, it was understood that FOAZ possesses many water molecules in its structure. Thus, it was assumed that FOAZ could be a proton source in the laser desorption ionization by using its abundant water molecules. Figures 6a & 6b show the mass spectra of nicotine (Nic) and cotinine (Cot), one of the metabolites of nicotine. In Figure 6a, the peak of protonated Nic, ([Nic+H]+ ), was observed at m/z = 163. In Figure 6b, the peak of [Cot+H]+ was observed at m/z = 177. Therefore, it was understood that FOAZ could be a matrix that enables proton adduction. In addition to the ionization by protonation, the following reactions could be considered because FOAZ has electron-donating ability (Scheme 1).
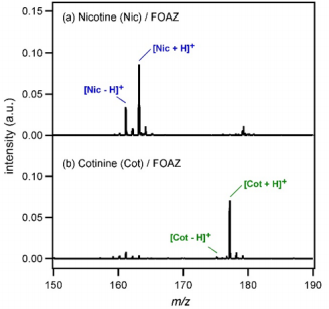
Figure 6: Mass spectra of
(a) nicotine (Nic) and
(b) cotinine (Cot) measured with FOAZ in the positive ion mode.
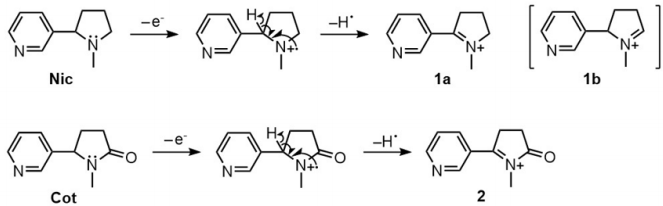
Scheme 1: Plausible mechanism for generation of [Nic-H]+ and [Cot-H]+ species.
For both Nic and Cot, it seems that the McLafferty rearrangement is not feasible because pyrimidine is a cyclic molecule and thus could not assume the appropriate conformation for [3,3]-sigmatropic rearrangement. Therefore, it is natural to consider the general fragmentation of amine as shown in Scheme 1. One-electron oxidation of the nitrogen atom in amine by electron impact produces the corresponding radical cation species. The subsequent dissociation of a hydrogen radical leads to iminium ion (1a). As Nic has two a-hydrogen atoms, structures 1a and 1b, which have the same molecular weight ([Nic-H]+ ), are possible. When the hemolytic of cleavage of proton is considered, however, the generation of 1a is more plausible than 1b because pyridine is an electron-withdrawing group. In addition, 1a is more stable than 1b because 1a has a p-conjugated system lying on the iminium and pyridine moieties. As Cot is an amide and has only one a-hydrogen atom, structure 2 ([Cot-H]+ ) is possible. 2 is considered stable because it has an expanded resonance structure through pyridine, iminium, and the carbonyl group. In the mass spectrum shown in Figure 6(a), a peak probably due to 1a ([Nic-H]+ ) was observed at m/z = 161, although its intensity was weaker than that of [Nic+H]+ (m/z= 163). In the mass spectrum of cotinine (Figure 6b), a peak probably due to 2 ([Cot-H]+ ) was observed at m/z = 175, although its intensity was very weak. Therefore, the fragmentation of Nic and Cot also proceeded by using an electron from FOAZ and was accompanied by the protonation of those compounds.
Nicotine and Cotinine in Mouse Cavity
Finally, the metabolism dynamics of Nic to Cot was examined by measuring saliva in mouth cavity. As shown in Table 1, the reproducibility of analyte ion intensity was improved by using FOAZ, and therefore, it could be said that the peak intensities in the mass spectrum fairly represent the amount of analyte. The time-dependent changes of the peak intensities of Nic and Cot in mouth cavity after smoking were investigated by MALDI MS. Saliva in mouth cavity was collected with a cotton swab and subjected directly to mass spectrometric measurements without any pretreatment including separation of those compounds by chromatographic techniques. Figure 7(a) shows the mass spectrum measured three hours after smoking as an example. Because there were many contaminants in saliva, many peaks were observed. Nevertheless, the peaks of [Nic+H]+ and [Cot+H]+ were observed at m/z = 163 and 177, respectively, without any pretreatment. The peak due to [Nic-H]+ was observed at m/z = 161. Although the mass number of m/z = 175 was the same as that of [Cot-H]+ , the peak was too large compared with the other peaks of Nic and Cot. Therefore, the peak at m/z = 175 was considered to be due to a contaminant in saliva. Other metabolites were observed as well, which are indicated by “a” and “b” in Figure 7(a); “a” was [nicotine-1’-N-oxide+H]+ and “b” was [trans-3’-hydroxycotinine+H]+ . Figure 7(b) shows the time-dependent changes of the peak intensities of [Nic+H]+ and [Cot+H]+ , and the solid curves are fitting results. Fitting was carried out by considering that the decay time constant of [Nic+H]+ was the same as the rise time constant of [Cot+H]+ , as shown in the following equation:
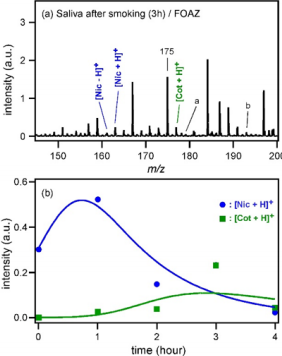
Figure 7: Mass spectra of
(a) Mass spectrum of saliva collected three hours after smoking, measured with FOAZ.
(b) Time-dependent changes of the peak intensities of [Nic+H]+ and [Cot+H]+, and the results of fitting.

By assuming t1 = 71.4 ± 22.0 min (= 1/k1), the results of MALDI MS could be reproduced. Therefore, it was understood that nicotine (Nic) absorbed by the human body was metabolized to cotinine (Cot) with the time constant of 71.4 min. A previous study of blood Nic and Cot concentrations indicated that the decay time of Nic was “around 2 hours” for a woman in her twenties [24]. Considering individual differences in nicotine metabolism, our results may be reasonable. Generally, saliva is still not popular as a test sample because it is speculated that cotton swab used for saliva collection would influence the results [25,26]. From the metabolism dynamics of Nic and Cot after smoking, however, it was understood that this technique could be a useful inspection method.
Conclusion
Functional organic analog of zeolite (FOAZ) was used as the matrix for laser desorption ionization mass spectrometry. FOAZ with parallelogram structures produced an absorption at 337 nm and possessed many water molecules in its structure. From its laser desorption ionization mass spectrum, it was understood that FOAZ could be an electron donor and a proton donor. The possibility of deploying FOAZ as a matrix for MALDI MS was investigated in the negative and positive ion regions by using stearic acid, nicotine, and cotinine as analytes. FOAZ was applied to the direct measurement of nicotine and cotinine in mouth cavity after smoking. Because of the high reproducibility of analyte ion intensity, the metabolism of nicotine to cotinine was investigated. It was clarified that nicotine was metabolized to cotinine with the time constant of 71.4 min.
Acknowledgement
T. F. acknowledges a Grant-in-Aid for Scientific Research (B) (No. 15H03772) from JSPS.
References
- H Rollema, JW Coe, LK Chambers, RS Hurst, SM Stahl, et al. (2007) Rationale, pharmacology and clinical efficacy of partial agonists of alpha4beta2 nACh receptors for smoking cessation. Trends Pharmacol Sci 28(7): 316-325.
- J Drope, N Schluger, Z Cahn, J Drope, S Hamill, F , et al. (2018) The Tobacco Atlas, in, American Cancer Society and Vital Strategies. Atlanta p. 22-25.
- G Skarping, S Willers, M Dalene (1988) Determination of cotinine in urine using glass capillary gas chromatography and selective detection with special reference to the biological monitoring of passive smoking. J Chromatogr 454: 293-301.
- P Jacob, AT Shulgin, L Yu, NL Benowitz (1992) Determination of the nicotine metabolite trans-39-hydroxycotinine in urine of smokers using gas chromatography with nitrogen selective detection or selected ion monitoring. J Chromatogr 583(2): 145-154.
- P Jacob, L Yu, G Liang, AT Shulgin, Benowitz NL (1993) Gas chromatographic-mass spectrometric method for determination of anabasine, antabine and other tobacco alkaloids in urine of smokers and smokeless tobacco users. J Chromatogr 619(1): 49-61.
- SA McAdams, ML Cordeiro (1993) Simple selected ion monitoring capillary gas chromatographic-mass spectrometric method for the determination of cotinine in serum, urine and oral samples. J Chromatogr. 615(1): 148-153.
- JT Bernert Jr., WE Turner, JL Pirkle, CS Sosnoff, JR Akins, et al. (1997) Development and validation of sensitive method for determination of serum cotinine in smokers and nonsmokers by liquid chromatography/ atmospheric pressure ionization tandem mass spectrometry. Clin. Chem 43(12): 2281-2291.
- MC Bentley, M Abrar, M Kelk, J Cook, K Phillips (1999) Validation of an assay for the determination of cotinine and 3-hydroxycotinine in human saliva using automated solid-phase extraction and liquid chromatography with tandem mass spectrometric detection. J Chromatogr. 723(1-2): 185-194.
- R Pacifici, S Pichini, I Altieri, M Rosa, A Cacosi, A Caronna (1993) Determination of nicotine and two major metabolites in serum by solid-phase extraction and high-performance liquid chromatography, and high-performance liquid chromatography-particle beam mass spectrometry. J Chromatogr 612(2): 209-213.
- KT McManus, JD DeBethizy, DA Garteiz, GA Kyerematen, ES Vesell (1990) A new quantitative thermospray LC-MS method for nicotine and its metabolites in biological fluids. J Chromatogr Sci 28(10): 510-516.
- K Rustemeier, D Demetriou, G Schepers, P Voncken (1993) Highperformance liquid chromatographic determination of nicotine and its urinary metabolites via their 1,3-diethyl-2-thiobarbituric acid derivates. J Chromatogr 613(1): 95-103.
- T Tuomi, T Johnsson, K Reijula (1999) Analysis of Nicotine, 3-Hydroxycotinine, Cotinine, and Caffeine in Urine of Passive Smokers by HPLC-Tandem Mass Spectrometry. Clin Chem 45(12): 2164-2172.
- M Meger, I Meger Kossien, A Schuler-Metz, D Janket, G Scherer (2002) Simultaneous determination of nicotine and eight nicotine metabolites in urine of smokers using liquid chromatography-tandem mass spectrometry. J Chromatogr B 778(1-2): 251-261.
- TP Moyer, JR Charlson, RJ Enger, LC Dale, JO Ebbert, et al. (2002) Simultaneous Analysis of Nicotine, Nicotine Metabolites, and Tobacco Alkaloids in Serum or Urine by Tandem Mass Spectrometry, with Clinically Relevant Metabolic Profiles. Clin Chem 48(9): 1460-1471.
- H Kataoka, R Inoue, K Yagi, K Sato (2009) Determination of nicotine, cotinine, and related alkaloids in human urine and saliva by automated in-tube solid-phase microextraction coupled with liquid chromatography - mass spectrometry. J Pharm Biomed Anal 49(1): 108-114.
- JP Xie, SH Sun, HY Wang, YL Zong, C Nie, et al. (2006) Determination of nicotine in mainstream smoke on the single puff level by liquid-phase microextraction coupled to matrix-assisted laser desorption/ionization Fourier transform mass spectrometry. Rapid Commun. Mass Spectrom 20(17): 2573-2578.
- M Benton, F Rowell, L Sundard, M Jan (2010) Direct detection of nicotine and cotinine in dusted latent fingermarks of smokers by using hydrophobic silica particles and MS. Surf Interface Anal 42(5): 378-385.
- T Nakanishi, T Nirasawa, T Takubo (2014) Quantitative Mass BarcodeLike Image of Nicotine in Single Longitudinally Sliced Hair Sections from Long-Term Smokers by Matrix-Assisted Laser Desorption Time-of-Flight Mass Spectrometry Imaging. J Anal Toxicol 38(6): 349-353.
- Y Aoyama, K Endo, K Kobayashi, H Masuda (1994) Hydrogen-bonded network and enforced supramolecular cavities in molecular crystals: An orthogonal aromatic-triad strategy. Guest binding, molecular recognition, and molecular alignment properties of a bisresorcinol derivative of anthracene in the crystalline state. Supramolecular Chem 4(3): 229-241.
- M Sakurai, T Sato, J Xu, S Sato, T Fujino (2018) Matrix-Assisted Laser Desorption Ionization Mass Spectrometry of Compounds Containing Carboxyl Groups Using CdTe and CuO Nanoparticles. Appl Sci 8(4): 492.
- M Yang, T Fujino (2014) Quantitative analysis of free fatty acids in human serum using biexciton Auger recombination in cadmium telluride nanoparticles loaded on zeolite. Anal Chem 86(19): 9563-9569.
- Y Komori, H Shima, T Fujino, JN Kondo, K Hashimoto, et al. (2010) Pronounced Selectivity in Matrix-Assisted Laser Desorption-Ionization Mass Spectrometry with 2,4,6-Trihydroxyacetophenone on a Zeolite Surface: Intensity Enhancement of Protonated Peptides and Suppression of Matrix-Related Ions. J Phys Chem C 114(3): 1593-1600.
- C Kitaoka, T Asano, T Fujino (2017) Direct Measurement and Quantification of Drugs and Their Metabolites in Urine by MALDI-MS Using Zeolite. Bull Chem Soc Jpn 90(2): 154-160.
- M Nakajima, Si Yamagishi, H Yamamoto, T Yamamoto, Y Kuroiwa, et al. (2000) Deficient cotinine formation from nicotine is attributed to the whole deletion of the CYP2A6 gene in humans. Clin Pharmacol Ther 67(1): 57-69.
- EA Shirtcliff, DA Granger, E Schwartz, MJ Curran (2001) Use of salivary biomarkers in biobehavioral research: cotton-based sample collection methods can interfere with salivary immunoassay results. Psychoneuroendocrinology 26(2): 165-173.
- L Strazdins, S Meyerkort, V Brent, RM D’souza, DH Broom, et al. (2005) Impact of saliva collection methods on sIgA and cortisol assays and acceptability to participants. J Immunological Methods 307(1-2): 167- 171.
