 Review Article
Abstract
The aim of this project was to develop a computerized algorithm that could be used to accurately assess the protection required (in terms of dose rates) in the design of Radiotherapy bunkers. This included primary, scattered photon beams and neutron scattered beams. There are commercial computerized models available (mainly Monte Carlo based), but they are expensive and smaller institutes do not have readily available access to these models. Most radiotherapy departments rely on various publications on the subject of bunker design such as and use empirical formulae to estimate the protection required. The formulae tend to be incorporated in spreadsheet format but may become cumbersome. However, they must be revisited each time for accuracy and modernization, as often the LINAC 1 (Linear Accelerator) specification and the design criteria (dose constraint) change with time. Given the above, creating an automated model /solution to shielding design calculations for high energy radiation was the task. Python was chosen as the programming language of choice to investigate the above.
The radiotherapy bunkers in St. Vincent’s Private Hospital were used as the primary design to check the accuracy or validity of the program. For the above, there were existing calculated and measured dose rates for the bunkers which facilitated comparisons of results. Once the accuracy was determined, other bunker designs were assessed. This model has been used on the St. Vincent’s Private Hospital Radiotherapy clinic as a ’backup check’ of their existing calculations. It is hoped that one day it may be used as an aid to modify existing bunkers, or indeed in the design of next generation bunkers.
Introduction
Not long after the discovery of x-rays, it soon became clear that not only could they have beneficial effects in diagnosis and therapy, they could also have detrimental effects and could cause damage to tissue. “Early pioneers in Radiology and Radiotherapy gave little thought to radiation protection and their own health paid the price. Current radiation insulations are governed by strict legislation, which in the UK and Ireland requires the involvement of a Radiation Protection Adviser (RPA) in the design and verification of radiation facilities shielding.” [1-3]. The shielding used in diagnostic imaging departments may be accomplished by the addition of lead or lead equivalence products (steel, concrete, barium plaster) in the barriers (walls, doors and windows ) and the vast majority of x-ray diagnostic installations may be protected by 2-3mm lead equivalence for energies up to 120kV (120,000 V). Radiotherapy shielding presents very particular problem because of the high photon energies generated by the linear accelerators that may be in excess of 15 MV (15,000,000 V). Neutron production in beam operating above 10 MV also presents its own specific shielding considerations.
Recent developments in Radiotherapy treatment technology (Intensity Modulated Radio- therapy (IMRT), Volumetric Arc Radiotherapy, (VMAT) and Flattening Filter Free, (FFF) in addition to new products used to build bunkers place an ever-increasing demand on traditional empirical calculations. They are usually based on look up tables featured in the above publications and employed in spreadsheets to predict the exiting dose rate on the other side of the barrier. Furthermore, upgrades of departments and changing national legislation governing environmental radiation levels reflect in a need to continuously update and validate the spreadsheets. The design of each radiotherapy bunker is unique due to the particular department which requires a reworking of the spreadsheets and calculation. Each review tends to be detailed; time consuming but must be precise (errors are costly when barrier thickness of up to 3.0m concrete is required to attenuate the primary beams). There is little room for correction once the design has been approved and construction takes place.
Theory/Background
Radiation and Cells (Radiobiology)
Cells grow and divide to form new cells. Unlike normal cells, cancer cells grow in an un- controlled manner leading to the formation of a growth or tumor. The tumor type can either be benign or malignant. The latter can replace or destroy normal cells and the body’s healthy tissue leading to illness [4]. Radiation therapy works by making small breaks in the DNA of cancer cells, which prevent the cell from growing and dividing and cause them to die [4]. Radiation therapy can either damage DNA directly or create charged particles within the cells that can in turn damage the DNA. Radiation therapy can of course still damage normal cells, which leads to dangerous side effects that Radiation Oncologists must take into account when planning a course of radiation therapy [5].
Linear Accelerator
Most models of linear accelerators produce 2-3 x-ray beams with an end point energy ranging from 6 to 18MV, and typically 5 electron beams with energy ranging from 6-18MeV. The purpose of the differing end point energies is to facilitate a range of patient treatments [1]. Due to the penetrating nature of the high energy photons, the linacs must be sited in a shielding bunker whose purpose is to reduce external dose rates to meet constraints imposed by national legislation. Traditionally linear accelerators are mounted about a gantry which allows the treatment beam to rotate about the treatment couch. They are designed such that the center of the radiation beam always passes through a point on the patient known as the isocenter. The distance between the point of generation of the x-rays and the isocenter is typically 1 meter. The treatment couch is also designed such that to rotate around the isocenter, giving more access to the beams to enter the patient from a number of non-coplanar directions, thus reducing the radiation dose to normal tissue. The linear accelerator customizes the high energy x-rays or electrons to the shape of a patient’s tumor in order to destroy cancerous cells whilst also sparing the surrounding normal tissue [6].
Working Principles of a linear Accelerator
Radiofrequency waves are pulsed into the waveguide by a magnetron (An electron tube for amplifying or generating microwaves, with the flow of electrons controlled by an external magnetic field [7,8]) which are then synchronized with the injection of electrons from an electron gun. This electron gun works by heating the tungsten filament within the cathode, and the produced electrons are then injected into the waveguide. The number of electrons injected is controlled by the temperature of the filament. The radio frequency waves accelerate the electrons along the waveguide to a speed approaching the speed of light. A vacuum is created along the waveguide to ensure the electrons are not impeded by other particles. The photon beams are produced when the electrons collide and interact with a heavy metal target, usually lead or tungsten. This is demonstrated in Figure 1. The path of the electron beam in the waveguide is controlled by two sets of quadrupole magnets which surround the waveguide, known as steering coils. An additional two sets of focusing coils surround the waveguide which help to further define and focus the electron beam. The power and frequency of the radiofrequency waves are controlled by the magnetron, which determine the energy of the x-rays produced? The entire system is cooled by water to prevent overheating. For more information on the working principles of the linac (linear accelerator), see Appendix A- D.
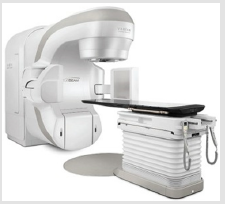
Figure 1: Example of a linear accelerator [1].
Radiation Exposure and Dose Measurement
Radioactivity: Radioactivity refers to the spontaneous disintegration of a substance or material, with the release of energy in the form of ionizing radiation. It measures and refers to how many atoms in the material decay in a given time period. It uses the units of the Curie (Ci ) and the becquerel (Bq ) [9].
Exposure: Exposure describes the amount of radiation travelling through a medium. The units are Coulomb/Kg (C/kg ) and the Roentgen (R) [9].
Absorbed Dose: Absorbed dose describes the amount of radiation absorbed by a material. The units for absorbed dose are the radiation absorbed dose (rad ) and the gray (Gy ) [9].
Equivalent Dose: Equivalent Dose combines the amount of radiation absorbed and the radiation weighting factor. Also known as the quality factor, the radiation weighting factor is dependent upon the type of radiation absorbed. These radiation weighting factors are seen in Table 1 and use the unit of Sieverts (Sv).
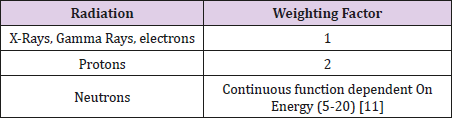
Table 1: Radiation Weighting Factors [10].
Effective Dose: The tissue-weighted sum of the equivalent doses and represents the stochastic health risk to the whole body [10]. Effective dose also uses the unit of Sieverts (Sv). It is not a quantity that can be directly measured, rather it can be derived from measurements of exposure with corrections for the weighting factor of radiation type and tissue weighting factors for a nonuniform exposure of an individual. Dose constraints used in the design of x-ray facilities are set in terms of effective dose [1].
Dose Rates: Dose rates can be measured at a particular moment in time, referred to as instantaneous dose rates (IDR), or averaged over a period of time, the time averaged dose rate TADR. The TADR is the IDR multiplied by the expected daily beam on time averaged over an eight-hour day i.e. taking account of workload and usage factors.
Dose Constraints in Ireland
Both IDR and TADR (over the working year of 2000 hours) must be taken account of both the photon and neutron contribution. The IDR for areas of exposed workers is set at an upper limit of 20μSv/ hr, whilst areas where members of the public may be present has an upper IDR limit of 7.5μ Sv/hr. These constraints are different in the UK and US, hence copying or replicating the designs of another jurisdiction may not meet the Irish design criteria. This may result in a refusal of the Environmental Protection Agency to grant a license to the radiotherapy institute. Over the years, there has been a downward trend on dose constraints in Ireland and it is difficult to future proof bunker design against this background of change.
Dose Rates: Dose rates can be of instantaneous dose rates (IDR) or time averaged dose rates (TADR). The former can be directly measured, with the latter accommodated by incorporating the IDR and accounting for use factors and occupancy over the course of a year. Physically, the dose rate falls off with the inverse square and the attenuation provided by the shielding. These properties are mainly used to attenuate primary/scattered radiation in bunker design. The use of a maze at the entrance to the bunker is popular as the multiple scatterings and absorption of the walls reduces dose rates to a point where one does not need a heavy lead door (or a considerable lighter lead door) to protect the entrance against photons and neutrons scattering down the maze.
Neutron Production
Neutron production can occur in any x-ray beam operating above 8.5MV. The likelihood is significantly increased for 15MV x-ray beams [11-13]. Photo neutrons are produced when x-ray beam interacts with the high atomic number components in the treatment head such as lead and tungsten [1]. Produced neutrons are moderated in the treatment room by x-ray shielding in treatment head and by scattering off bunker walls. Total neutron fluence in the room comprises of fast neutrons, scattered neutrons and thermal neutrons. According to [2] accelerators operating in range 10-25MV, the mean energy of neutrons from the treatment head is approx 1MeV, mean energy of the neutrons scattered by the walls of the room is approx 0.24MeV, giving a mean neutron energy (excluding thermal neutrons) of 0.34MeV [1]. The ratio of neutrons to x-ray photons increases with beam energy [14]. At 10MV, the neutron dose is approximately 40μSv per photon Gy, whereas at 15MV it is about 1mSv per photon Gy [1].
Attenuation Properties
A commonly used value with regards to shielding is the ”tenthvalue layer” (TVL) and the ”half-value layer” (HVL). This is the amount of a material needed to decrease a dose to one tenth or one half of its original value respectively. However, beam hardening must be considered, therefore both the first TVL and subsequent equilibrium TVL must be used.
Bunker Design and Shielding
The purpose of a radiotherapy bunker is to reduce external dose rates to below the respective design dose constraints. Building bunkers is an expensive process and while bunkers have an average lifespan of approximately 30 years, each linac is only in use for approximately 10 years. Hence when designing bunkers, it is crucial to plan for future advancements in the field of radiotherapy Figure 2.
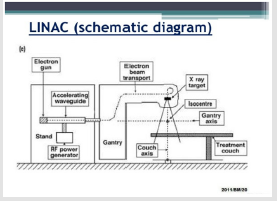
Figure 2: Working Principles of a linear accelerator [7].
Primary and Scattered Photon Shielding: The treatment beam is known as the primary beam; the energy of this beam and the penetrative quality are determined by the accelerator potential from the generator and the filtration incorporated into the beam respectively. In a conventional room, areas of the wall/ceiling/ floor that can be irradiated by the primary beam are known as primary barriers and need an in- creased thickness of shielding to attenuate x-ray beam when falling directly on these barriers after passing through patient. The projection of the field rotated through 45◦ (collimator rotation) determines the width of the primary barrier in the walls/roof. Leakage radiation also exists when the linac produces primary radiation. Unlike the primary radiation, leakage can emanate from the machine head isotopically. There is a restriction on leakage radiation by International Electrotechnical Commission (IEC) limiting this radiation to 0.1% of the original beam intensity [15]. The energy of the leakage radiation is similar to the primary beam. Radiation is also produced when it bounces off the patient and walls of the treatment room, contributing to scattered radiation. The latter radiation has an energy spectrum considerably lower than the primary radiation. Areas of the wall irradiated only by leakage and scattered radiation are known as secondary barriers [1].
Neutron Shielding in Maze: In primary and secondary barriers the concrete cross-section tends to be thick enough to attenuate the neutrons. The production of neutrons in beams operating above 8.5 MV present a particular challenge with regards to shielding in mazes if and when a door has to be added. Dose rate due to neutron capture gamma rays and neutron fluence often exceeds the scattered x-ray dose rates especially for short mazes. These doors must incorporate borated polyethylene (BP), with this substance being particularly effective for thermal neutrons. However, once the neutron flux is captured by the borated polyethylene, gamma rays are released. A heavy door at the entrance to the bunker made as a sandwich of borated polyethylene covered on either side by lead is needed, all within a steel door frame. The lead on the incident side of the door reduces the neutron energy by scattering. The lead on the outside of the door attenuates the capture gamma radiation from the borated polyethylene, which has an energy of 0.48MeV [1]. However, reports such as [16] suggest that external lead may not be necessary if a sufficiently long maze is used. IAEA et al. [2] has adopted a simple approach to calculating the required amount of borated polyethylene and lead needed, by supposing that each substance contributes half the dose rate constraint. As neutron fluence can travel down the maze, [14,17] the dose rate at the maze entrance must include the: neutron dose, gamma ray dose from captured neutrons and the doses due to x-ray scatter and maze wall penetration.
Neutron Production and Scatter: As described in section (2.7.2), the issues associated with neutron production and attenuation become relevant once energy beams of over 8.5 MV are used. McCall et al. [16] has shown that the total neutron fluence at the inner maze entrance (point A in Appendix A (Figure 3)) per unit x-ray absorbed dose is given by equation (22). McGinley et al. [18] states that the IDR and TADR of the dose equivalent (Hγ) from the neutron capture gamma rays at the outer maze entrance are given by equations (23) and (24) from Table 2 respectively. Where 6.9 × 10¹⁶ is an experimentally determined factor by [14] and is the ratio of the neutron capture gamma ray dose equivalent (Sv ) to the total neutron flux at point A (1). [19] state that the neutron dose at the maze entrance is given by equation 25 For each additional leg used in a maze, the total neutron fluence is decreased by a factor of 3, [1], hence the necessity to include the factor of 1 in equation (25) from (Table 2).
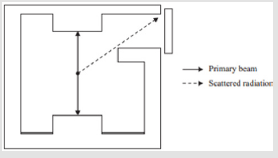
Figure 3: Sample bunker design with maze and door [1].
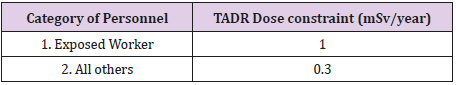
Table 2: Dose constraints in Ireland as set by the office of Radiological Protection (ORP) formerly known as Radiological Protection Institute of Ireland (RPII) [1].
Scatter in Maze
Scatter of the Primary Beam Off the Bunker Wall: The scatter of the primary beam off the bunker walls depends on the orientation of the beam with respect to the maze. To simplify this, two orientations of the beam parallel and perpendicular to the maze are described as the only options. These orientations are seen in Figures 4 & 5.
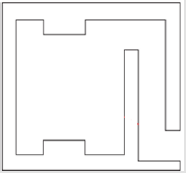
Figure 4: Energy beam parallel to maze entrance [1].
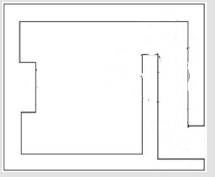
Figure 5: Energy beam perpendicular to maze entrance [1].
Patient Scatter Radiation: Patient scatter radiation does depend on the orientation of the beam, hence [1] states that the IDR and the TADR at the maze entrance due to scatter off the patient can be calculated via equations (16) and (17) respectively.
Head Leakage Scatter Radiation by the Bunker Wall: The leakage radiation is the radiation coming through the treatment unit head. This is considered to be isotropic (360◦), hence has no dependence on the orientation of the treatment beam with respect to the maze entrance. Similar to the scatter off the patient, the source position is taken as the isocenter. [1] states that the IDR and TADR at the maze entrance due to the scatter of head leakage radiation by the bunker walls are given by equations (18) and (19) respectively. The 0.001 factor is to account for the fraction of the dose due to head leakage at 1 m from the target relative to the dose on the beam axis 1 m from the target [1].
Head Leakage Transmission Radiation Through Inner Maze Wall: IPEM et al [1] state that the IDR and TADR at the maze entrance due to transmission of head leakage radiation through the inner maze wall are given by equations (20) and (21) respectively.
Scatter Coefficients: The patient scatter factor value is found and is dependent on the energy of the beam, whilst the reflection coefficients α1, α2, α3 etc. for scatter off the wall, patient and head leakage are taken. The first scatter co-efficient α1 for the wall and patient scatter is dependent upon:
a) The energy of the incident beam,
b) The angle of incidence and
c) The angle of reflection. However, once the first scatter off the patient and reflection off the wall has occurred, the scattered radiation experiences a drop-in energy to a generally accepted value of 0.5MeV [14,2]. Hence, α2 and beyond is no longer dependent on the energy of the beam used, but on the effective energy.
Maze Doors and Lining: A shielded door may become necessary in a conventional room (or indeed a Cybercide facility) in circumstances when the constraints on IDR and TADR are unable to be achieved via a sufficiently long maze or a sufficient number of maze legs. The transmission factor of this door is given by equation (27). Kersey et al. [20] has shown that lead has a TVL of 6mm for the energies involved if the total maze length is greater than 5m. However, if the total maze length is less than 5m, [13] states that the TVL of lead is 61mm. For linear accelerators operating above 8.5 MV where neutron production occurs, gamma rays and neutrons must be captured. As is described in section (2.7.2), borated polyethylene (BP) must be used to attenuate these neutrons. Both [2,14] recommend a TVL of 45mm for borated polyethylene. IAEA et al. [2] adopt the simple approach to calculate the required thicknesses of BP and lead by assuming that each contribute half of the required dose rate constraint.
Treatment Modalities
This project focuses on bunker designs that houses (1) conventional linear accelerators and (2) Cybercide facility.
Direct door - Cybercide treatment: Cybercide facility employs a photon beam operating at 6MV therefore no neutron production can occur during this treatment. Furthermore, as the Cybercide can point in any horizontal direction, the direct door may become a primary barrier. A further explanation of how Cybercide treatments operate is offered in Appendix (E.4)
Computational Method
This project was computed using the programming language of Python. As there are six separate algorithms within the project, the methods used for each program are described individually below.
Algorithms
IDR use with Primary/Secondary Barrier:
A. Primary barrier IDR Algorithm: This algorithm calculates the IDR behind a primary barrier for a given set of userentered parameters. These parameters are found in appendix. If this IDR is higher than the user-specified constraints, the algorithm will calculate what thickness of a user-selected material is needed as a ”second layer barrier” beyond the initially specified material and thickness. Algorithms for the IDR behind both a primary and secondary barrier followed the same method. This is illustrated in the flowchart found in Figure 5. The following derivation shows how the thickness of a second layer material was found in the algorithm designed to compute the IDR behind a primary barrier. All equations used are taken from unless stated otherwise.
a) From equation (7), the required number of TVLs, n is isolated to read
n = t − TV L1 + 1 (1)
TV Le
Where the TVL values are the Primary beam TVL’s found in Appendix (G.1).
b) This can be referred to as nc, and refers to the analytically calculated value of n. The analytically calculated value of the transmission factor, Bc can be simply found by referring to equation (5).
c) The IDR behind a primary barrier can be found via use of Bc in equation (8).
d) If the calculated IDR (IDRc) is greater than the desired IDR (IDRr), the user will be asked to specify what material to be placed as a second barrier beyond the initial barrier. This barrier will be referred to as material 2. The following derivation is implemented in order to calculate the required thickness of this chosen barrier, in order to attenuate the dose.
a. By rearranging equation (8), Br, (the required transmission coefficient) can be found by plugging in IDRr as the IDR.
b. The required number of TVLs (nr) can be found through use of equation (6).
c. Hence, if the sole barrier attenuating the IDR was that of material2, this thickness would be found by setting up equation (7)
d. Where tr refers to required thickness, nr refers to the required n value, TVL1ii and TVLeii refer to the set TVL values.
e. As a barrier (material1) of thickness t already exists, the equivalent thickness, tequiv must be found.
f. The equivalent thickness is the thickness of material2 that has the same attenuating effect as the thickness t of material1.
B. Secondary Barrier IDR Algorithm: The parameters entered by the user in order to run this algorithm are found in appendix. While the algorithm here mimics the process of that of section (3.1.1), one must accommodate the following changes:
a) All equations involving the use of TVL’s, acquire these values from the secondary barrier TVLs (found in Appendix (G.2).
b) To calculate the IDR behind a secondary barrier, equation (10) is used.
c) To find Br, equation (10) is rearranged.
TADR use with Primary/Secondary Barriers
A. TADR - Primary Barrier – Algorithm: The workings of the TADR algorithm follow a similar method to that of the IDR algorithm, in that it will calculate the TADR behind a primary barrier for the set of user-entered parameters found in appendix.
a) As there may be up to three energy beams in use, the IDR method is implemented on three separate occasions, each independent of the others.
b) By labelling each of the three energies used as energy A (EA), energy B (EB ) and energy C (EC ) respectively and the fraction of treatments each energy is used for fracA, fracB and fracC respectively, the following calculations can be performed, where all equations used are taken unless stated otherwise.
c) The analytically calculated number of TVL’s for energy A (ncA ) can be found by substituting in the primary beam TVL values of energy A and the user-specified thickness of material1 into equation (1).
d) From this value, the analytically calculated transmission factor BcA can be found through use of equation (5) and hence the primary TADR due to EA (TADRA1 ) can be found through the implementation of equation (9)
e) This value of TADR is the total TADR that would occur if EA was the sole beam in use throughout a year. However, if other beams are in use one must use the method found in Appendix (F) to find the total contribution by EA to the TADR (TADRA), and hence the total TADR due to a combination of energy beams.
f) The derivation of tequiv is the same as that of equation (4). The method found in Appendix (F) is used once again to find the absolute value of each individual thickness increase due to EA, EB and EC and hence the total thickness increase required increase.
B. TADR - Secondary Barrier – Algorithm: While the algorithm here mimics the process of that of section (3.1.2.1), to obtain an algorithm to compute the TADR behind a secondary barrier, one must accommodate the following changes, where all the equations used are taken unless stated otherwise:
a) All equations involving the use of TVL’s, acquire these values from the leakage TVLs (found in Appendix (G.2)).
b) To calculate the TADR behind a secondary beam, equation (11) is used.
c) To find Br, equation (11) is rearranged.
d) The user-entered parameters here are found in appendix.
Scatter Code Algorithms for Maze Entrance
One algorithm was constructed such that it had the ability to calculate the IDR and TADR due to x-ray and neutron scatter simultaneously. It also determined whether a maze is sufficient on its own or if a door is required at the end of the maze to attenuate the dose rate. The user-entered parameters needed to run this program are found in appendix (Figure 6).
Figure 6: Flowchart illustrating construction of Primary and secondary barrier IDR algorithms.
A. IDR Scatter Code Workings: Section A If neutron production does not occur due to the energy beam used being lower than 8.5MV and the IDR is greater than the constraint, the door thickness is calculated as follows:
1. The transmission coefficient (B ) of the door is calculated from equation (27).
2. From this, the thickness of lead required can be calculated via t=TVL× n. 3.1.3.2 TADR scatter code The TADR at the maze entrance algorithm due to scatter down the maze follows the same flowchart as that found in. Whilst the algorithm here mimics the process of that of section (3.1.3.1), the following changes must be made in order to construct an algorithm to calculate the TADR at the maze entrance due to scatter:
A. The total x-ray scatter at the maze entrance due to photons is found through the summation of equations (17) (patient scatter), [19] (head leakage scatter), (head leakage transmission) and equation (14) or (15) (wall scatter in the case of parallel or perpendicular orientation respectively). The values for the scatter coefficients used in the aforementioned equations are found in Appendix (H.1).
B. If equation (15) is to be used, the algorithm calculates the transmission coefficient of the inner-maze wall (BM). The following method is used to find this:
A. As three energy beams are assumed to be in use throughout a year, method (F) is used to calculate the average number of TVLs of the wall (n) due to the use of these differing energy beams.
B. From using n in equation (5), the transmission coefficient of the inner maze wall due to the different energy beams is computed (Figures 7 & 8).
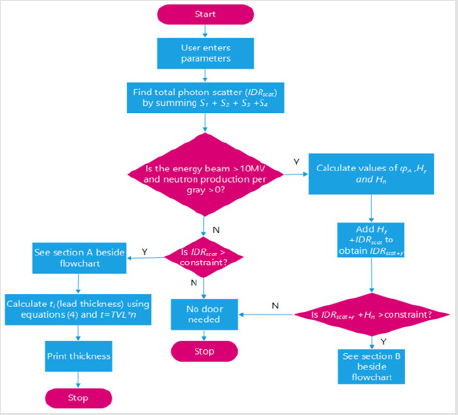
Figure 7: Flowchart illustrating construction of scatter algorithm.
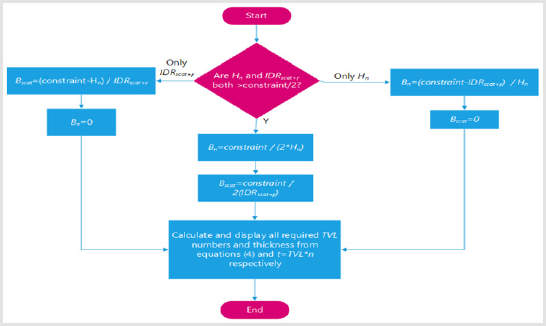
Figure 8: Method used to calculate door thickness when Hn+IDRscat+γ is greater than the dose constraint.
C. The total TADR at the maze entrance due to x-ray scatter down the maze was found by summing the values found from the aforementioned equations together, using the method found in Appendix (F).
Direct Door - Cyber knife Treatment Algorithm
As was described in section (2.9.1), the direct door during Cyber knife treatment is a primary barrier. Furthermore, as 6MV is the only beam energy used, this further simplifies the algorithm. To calculate the thickness of lead needed to attenuate the IDR, the follow procedure is required:
a) By isolating B from equation (8) (where IDRr is the IDR) the transmission factor can be calculated.
b) B is used in equation (6) to find the number (n) of TVLs required.
c) The required thickness of lead is computed via use of this n value along with the TVL values found in Appendix (G.1) in equation (7),
Graphical User-Interface (GUI)
In order to make the program user-friendly, a Graphical User- Interface (GUI) was incorporated. This was done through importing ”Tkinter ”, a toolkit for Python (see Appendix (J.1) for more information). All project content visible to the user was created using this package.
Display Windows: The flowchart of the creation and displaying of the windows observed is shown in Figure 9. As can be seen, multiple windows are used within each program sequentially (see Appendix (J.1.1)). This was performed through the method of ”stacking” and is illustrated in the following flowchart.
Accepting Entry from Text Boxes: The flowchart illustrated in Figure 10 summarizes how text entry boxes were created and their inputs read. Appendix (J.1.2) offers an illustrated example of this code. Drop-down menu boxes Appendix (J.1.3) offers an illustrated example of the code used in the flowchart found in Figures 11 & 12.
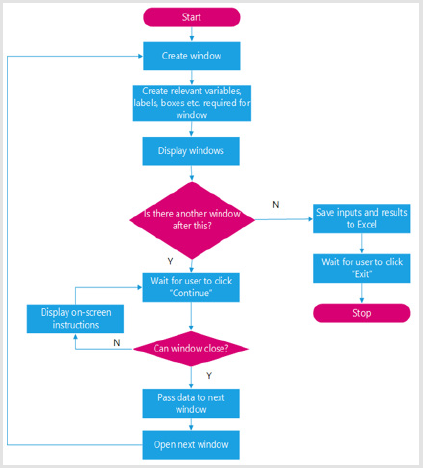
Figure 9: Flowchart illustrating creation of windows in GUI.
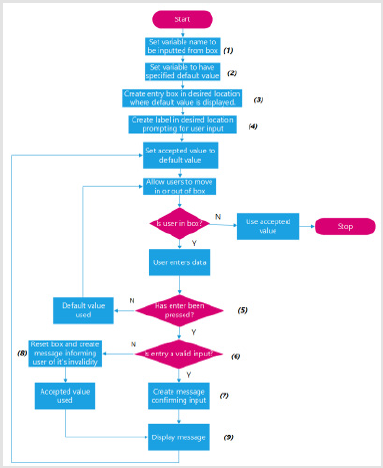
Figure 10: Flowchart illustrating the creation and reading of text entry boxes.
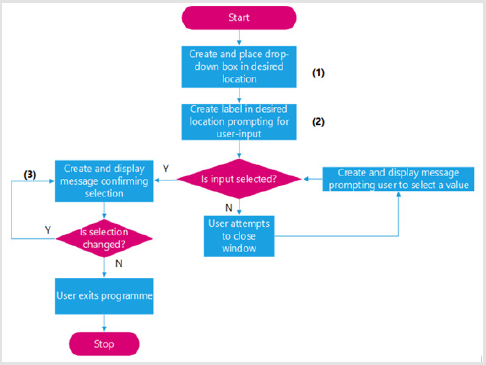
Figure 11: Flowchart illustrating creation and reading of drop-down menu selections.
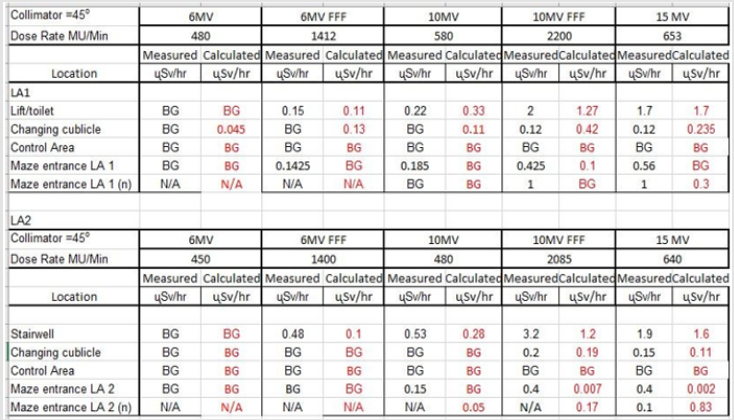
Figure 12: Comparison between calculated dose rates and measured dose rates at St. Vin- cent’s Private Hospital3.
Converting Algorithm to Executable: Due to restrictions on software installations on hospital computers, neither Python nor Spyder could be installed at St. Vincent’s hospital. Hence in order for the program to run on these terminals, it was converted to an executable file. See Appendix (J.2) for more information.
Results and discussion
Results
Calculation Results: Calculated results found using the algorithms developed in this project were compared against the actual dose rates measured outside radiotherapy bunkers at St. Vincent’s Private Hospital. This was to validate the accuracy of the algorithm in calculating the dose beyond primary and secondary barriers and at the maze entrance. The results indicate a satisfactory agreement between the calculated and measured dose rates for St. Vincent’s Private Hospital. This algorithm was then tested on The Hermitage Medical clinic’s bunker plans, with the values compared to those calculated by the Radiation Protection Advisor (RPA). IPEM et al. [1] state that calculated dose rates may be off by a factor of 10. This was experienced in The Hermitage Medical Clinic design. Calculating the value of the scatter at the maze entrance is an approximation, however measurements indicate the algorithm gives results of the correct order of magnitude. It can be concluded that the program works to the same level of accuracy as indicated in publications such as [1]. The bunker plans used to calculate these values for St. Vincent’s Private Hospital and The Hermitage Medical Clinic are displayed in Appendix K(Figure 13) respectively.
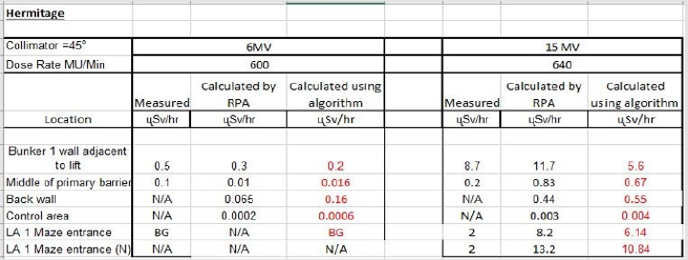
Figure 13: Comparison between calculated dose rates using the algorithm described in this report and the dose rates measured and/or calculated by the RPA at The Hermitage Medical Clinic3.
GT : Total sprouts Pl : Rainy season.
CT : Total Coliforms Se : Seasons.
Graphical User-Interface: The GUI was successfully implemented via the method described in section (3.2). (Figures 14 & 15) offer illustrated examples of this interface. For a more visual example, any of the attached programs can be run.
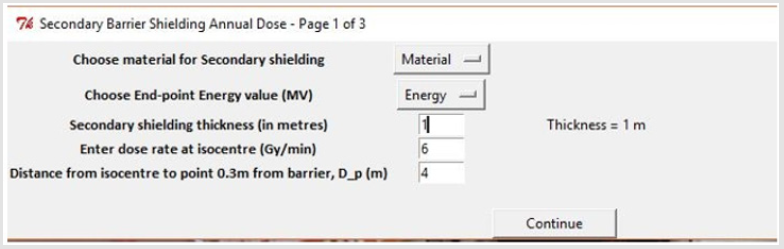
Figure 14: Example of values being taken from text box.
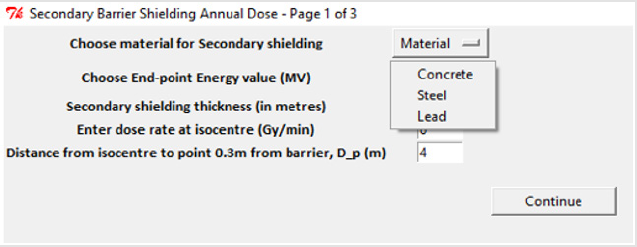
Figure 15: Example of values being selected from a drop-down menu.
Error Analysis: Data used in calculations are derived from tables taken from publications and have been established to a high degree of accuracy. Variations between measured and calculated doses can show discrepancies of up to 100% [1], however the calculations give results that are the correct order of magnitude and hence are fit for purpose for the type of work involved. The philosophy in radiation protection is to always air on the safe side and to allow for a margin of error. This would be accommodated in the parameters used in the algorithm i.e. instead of calculating for treating 30 patients a day, one could calculate for 35 patients.
Discussion
The calculation algorithm has been used and tested on the St. Vincent’s Private Hospital Radiotherapy bunker plans. The results section indicates that there is good agreement between the calculated and the measured dose rates behind primary and secondary barriers and indeed, dose rates at the maze entrance. This also included the neutron dose component when beams of 10 and 15MV were employed. The model was further tested on two more facilities. One had existing calculated dose rates and the other is a new facility in the design phase. The chief physicist is satisfied that it could be used as means of a ’back-up’ check. Its advantage lies in the fact that it can be used to give prompt results to assess the relevant dose rates. An instruction manual of how to use the program is found in the folder containing the program.
Future: Given the fact that new legislation is about to be introduced in Ireland and that LINAC technology is an ever-changing modality it is hoped this program could be used by the wider community of radiotherapy physicists as an aid to design bunkers. In order to bring this program to the attention of the relevant physicists I would like to either make an oral or poster presentation at the next meeting of the Irish Association of Physicists in Medicine (IAPM).
Conclusions
In conclusion, the research project was a success. The formulae described in reference [1] was successfully implemented into an algorithm. The analytically calculated results from the program are in good agreement with those calculated and measured by the chief physicist at St. Vincent’s Private Hospital. Depending upon space restrictions, some conventional bunkers are constructed without a maze, thus using a direct shielding door as the sole means of attenuating the dose rate. Direct shielding doors tend not to be a popular choice in bunker designs in Ireland, however in order to cover all eventualities from a radiation protection perspective an algorithm to calculate the dose rates when employing direct shielding door (for energies greater than 8.5 MV, when neutron production complicates the shielding requirements) should be developed to complete the model. Due to the complex nature and the fact that the thickness of these doors is best estimated by Monte Carlo simulations, it remained outside the scope of this research project. The design of such a model could be used as a follow up project. I am pleased with the user-friendliness of the program due to the GUI installed. Learning this new programming library offers a new challenge to be overcome if the program is to be actively used in hospitals. Unfortunately, due to the method of constructing the algorithm in section (3.2.1), a ’Back’ button could not be constructed such that the previous window was returned, meaning if one changes window after making a mistake, they have to enter the data again. Further study of Tkinter would be necessary in order to make the program more user friendly.
Acknowledgement
I would like to deeply thank my supervisor, Mr. Martin Sheridan for his consistent advice, guidance, and teaching of theory throughout my 9 weeks of computational laboratory experience. His help throughout made this project experience a valuable and rewarding one.
References
- (2017) IPEM (Institute of Physics and Engineering in Medicine) Design and treatment of radiotherapy treatment facilities. IPEM Report 75: 2.
- (2006)IAEA (International Atomic Energy Authority) Radiation protection in the design of radiotherapy facilities. Safety Report Series, p. 47.
- (2014) NCRP (National Council on Radiation Protection and Measurements) Structural shielding design for medical x-ray imaging facilities.
- American Cancer Society. Radiation therapy basics. US Department of Health and Human Services. National institute of health, National Cancer Institute. RSNA (Radiological Society of North America).
- (2015) Linear accelerator information. Muhammad Ovais Ur Rehman. Biomedical engineering system.
- (2017) Radiation and it’s health effects -measuring radiation. USNRC (United States Nuclear Regulatory Commission).
- (2007) The 2007 recommendations of the international commission on radiological protection. ICRP publication 103. 37(2-4): 1-332.
- (1990) 1990 recommendations of the international commission on radiological protection. ICRP Publication 60 Ann ICRP 21: (1-3).
- (2006) EPA (Environmental Protection Agency). Radiological protection institute of Ireland, dose constraints - radiotherapy.
- (1984) Neutron contamination from medical electron accelerators. NCRP (National Council on Radiation Protection and Measurements) 79: 128.
- Glasgow GP (2006) Structural shielding design and evaluation for megavoltage x- and gamma-ray radiotherapy facilities. Med Phys 33(9): 3578.
- (2009) Medical electrical equipment: Particular Requirements for the Safety of Electron Accelerators in the Range 1MeV to 50MeV, Part 2-1, IEC (International Electrotechnical Commission).
- Mc Call R C (1997) Shielding for thermal neutrons. Med Phys 21(1): 135- 136.
- Polf J, Mohan R, Kry SF, Howell RM, Vassiliev ON (2009) Treatment vault shielding for a flattening filter-free medical linear accelerator. Phys Med Biol 54(5): 1265-1273.
- McGinley PH, Minor MS (1995) A history of radiation shielding of x-ray therapy room health phys. Health Phys 69(5): 759-765.
- McGinley PH, Wu RK (2003) Neutron and capture gamma along the mazes of linear accelerator vaults. J Appl Clin Med Phys 4(2): 162-171.
- Kersey R W (1979) Estimation of neutron and gamma radiation in the entrance mazes of SL 75-20 linear accelerator treatment rooms. Medicamundi 24(3): 151-155.
- Jong Hoon Kim (2008) Linac-based high-precision radio- therapy: Radiosurgery, image-guided radiotherapy, and respiratory-gated radiotherapy. J Korean Med Assoc 51(7): 612-618.
- Gupta M, Singh N, Srivastava R, Jyoti B (2015) Cyberknife® : The cutting edge technology in precision surgery. 6(2): 106-115.
