 Research Article
Abstract
Background: In the early years of the 21st century, more and more researchers around the world are concerned about the service quality in business generally and in health care particularly.
Method: This descriptive-analytic study was carried out through qualitative and quantitative methods, follow the SERVQUAL scale of Parasuraman to measure the customer satisfaction and service quality of pharmacies in Ho Chi Minh city.
Results: The new scale to estimate the service quality of the GPP pharmacy consist of 29 variables, namely: service quality (5 factors and 24 variables), price (1 factor and 2 variables) and customer satisfaction (1 factor and 3 variables). Evaluation of the fit of the model through the results of R2 (0.521) and R2 adjust (0.518), this indicates the suitability of the model is 51.8% or in other words, the model explains 51.8% variability of satisfaction is due to 6 independent factors. The empathy factor (0.347) has the greatest impact on customer satisfaction, the remaining factors have nearly the same effect, namely capacity (0,254), reliability (0.244), responsiveness (0.237), price (0.217) and tangibility (0.209). The results of the statistical analysis show that there is a difference between the five control variables (gender, age, educational level, monthly income and survey site) in the perception of the components of the scale service, price and satisfaction.
Conclusion: The study has developed a new scale of GPP pharmacy service quality, price and customer satisfaction, as well as identifying the affecting factors and measure customer satisfaction. The results can help pharmacies’ trader plan a better business strategy.
Keywords: Service Quality; Customer Satisfaction; GPP Pharmacy
Abbreviations: SQ: Service Quality; CS: Customer Satisfaction; HCMC: Ho Chi Minh City; EFA: Exploratory Factor Analysis
Introduction
Pharmacies play an important role in the national health system in order to serve and care for the people’s health. This is one of the special types of pharmaceutical industry, where direct contact between patients and customers. According to Nguyen et al, more than 50% of the annual consumption of drugs is distributed through the pharmacy channel, moreover, the first choice of most people is pharmacy whenever their health’s problems occur [1]. With the rapidly growing in the numbers of pharmacies, 3,195 pharmacies in 2012 in Ho Chi Minh city [2], giving trader a difficult problem on how to not only increase competitiveness but also to ensure product’s quality. In the past, investors considered high-quality products at the lowest cost. However, people are more interested in the concept of service quality and customers’ satisfaction [3]. In parallel with the quality capacity of professional activity, enhancing the role of service quality in pharmacies is not only meaningful for the trader but also for the patient and for the whole society [4]. In the early years of the 21st century, more and more researchers around the world are concerned about the service quality (SQ) in business generally and in healthcare particularly [5,6].
Measurement of SQ is defined as an important means of assessing the performance level of an administrator as well as the successful level of a business project [7,8]. Additionally, recent studies have shown that customer satisfaction (CS), which is seen as an important goal to maintain service user loyalty, should also be taken into consideration [6,9]. Indeed, customer satisfaction, especially in the healthcare industry, is an integral part of goods or services supplier success [10]. By the time the study was conducted (2011), CS and QS in the pharmaceutical retail sector, namely GPP pharmacies, are still a new factor that needs to be researched to help investors navigate business governance. Therefore, this study was implemented to evaluate this relationship.
Material and Methods
Study Design
This descriptive-analytic study was carried out through qualitative and quantitative methods, follow the SERVQUAL scale of Parasuraman (1988) [11,12] with a combination of the Varki - Colgate and Brown model (2001) [13] and Miller’s scale (1977) [14] at GPP pharmacies in Ho Chi Minh city (HCMC) between 2011 and 2014.
Sampling
By conducting a literature review, study identified the minimum number of pharmacies needed to conduct the survey with a 95% confidence interval and a 5% error in the range of 353 to 364 pharmacies [15]. Combining with the actual data on the number of pharmacies in HCMC (3,195), the study selected 360 (N1) samples as the pharmacy sample size. According to Bentler (1987), in case of the sample size for non-probability sampling, the minimum customer sample size is defined by the standard 5:1 (i.e. the number of observations that needed to reach, at least 5 times the number of study variables plus 50) [8,16,17] following to the equation:
N = variable number * 5 + 50
where: N is the minimum customer sample size.
The scale of the study included 37 items, so the sample size was at least 235 samples. Nevertheless, from the fact that the number of pharmacies was very large and to improve the reliability of the study, the sample size was choosing to be 1440 (N2) samples, with the success rate is between 70-80%.
Inclusion Criteria
Customer have completed the purchase of medicines at GPP pharmacies and meet the following criteria (identified by three direct filters before inviting customers to participate in the survey), which are:
a) Does customer buy medicines for individual or for relative?
b) Is customer between the ages of 15 and 60?
c) Is customer interested in choosing a pharmacy?
Survey Instrument
By implementing the quantitative research from theoretical, data collection was conducted using a standard SERVQUAL questionnaire developed by Parasuraman in 1985. The questionnaire contained an “expectation” section with 22 items and a “perception” section consisting of a set of matching statements. The statements in both expectation and perception sections were categorized into five dimensions of reliability, responsiveness, capacity, empathy and tangibility. With the combination of the 3-items price scale from Varki – Colgate (2001) and Zeithamal (2000) and the 4-items satisfaction scale from Brown’s (1994) theory. It is accompanied by the conversion of terms to suit the target audience. A 5-point Likert scale was used for the scoring system with 1 representing “strongly disagree” and 5 representing “strongly agree”. This scale has a value range from 1 to 5, hence, the step will be: (5-1)/5=0.8. Finally, study design the levels of customer satisfaction follow:
a. 1 – 1.8: strongly unsatisfied
b. 1.8 – 2.6: unsatisfied
c. 2.6 – 3.4: neutral
d. 3.4 – 4.2: satisfied
e. 4.2 - 5: strongly satisfied
Considering the standard questionnaire, the face and content validity of the questionnaire has been confirmed by experts (a group of 10 pharmacists, who have experience managing pharmacies and 20 customers, who are regular medicine buyer). Additionally, to ensure questionnaire reliability, a pilot study was conducted on 30 customers had also confirmed with the results of Cronbach’s α are larger than 0.6.
Statistical Analysis
Statistical analysis was performed using SPSS version 18 (SPSS Inc., Chicago, IL, USA). Descriptive statistics were used to summarize customers’ characteristics. The study used the Exploratory Factor Analysis (EFA) method to select factors that assessed the GPP pharmacy quality scale, as well as the customer satisfaction. With KMO (Kaiser - Meyer - Olkin) value ranging from 0.5 to 1, EFA analysis is appropriate and Bartlett’s test to determine the correlated variables with a 95% confidence interval [18]. Study build the linear regression to evaluate the fit of the model (Figure 1) through the R2 coefficient and the VIF coefficient. Verification of the fit of the model by F-test. The t-test was used to define the significant difference of the gender and ANOVA and Kruskal Wallis test to measure the significant difference between age, education level, monthly income, and survey site in customer satisfaction value with the p-value < 0.05.
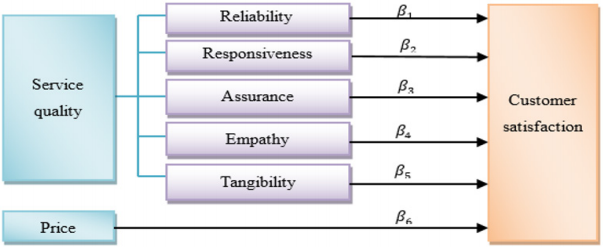
Figure 1: Study model.
Ethics
Written informed consent was obtained from participants who were involved in the study, before the specimen collection and the questionnaire survey began. This study was approved by the ethics committee of Vietnam Military Medical University.
Discussion
The study has developed a new scale of GPP pharmacy service quality, price and customer satisfaction, as well as identifying the affecting factors and measure customer satisfaction with the new scale at 360 GPP pharmacies in HCMC in the period of 2011 - 2014. So far, there has not been a Parasuraman scale model applied in the pharmaceuticals retail distribution of private pharmacies, so setting up a scale is the first and most important step that needs to be taken. With the implementation process going through many steps, the final scale is built, evaluated and adjusted several times to improve the reliability and accuracy of the survey results as well as the conclusions reached. The regression model describes the form of the relationship as well as predicts the degree of dependent variable when the value of the independent variable is known. The empathy factor (0.347) has the greatest impact on customer satisfaction, which is consistent with customer psychology when deciding to make a transaction at a pharmacy. The remaining factors have nearly the same effect, namely capacity (0,254), reliability (0.244), responsiveness (0.237), price (0.217) and tangibility (0.209).
This result is similar to Nguyen et al. in Kien Giang province (2012) [19]. Meanwhile, research by Tran et al. in Khanh Hoa (2015) [20], shows only the similarities in three factors: price, quality and empathy. Thus, it may be preliminary to conclude that the same scale of research is used, but in different markets there will be an appreciation of the factors that affect customer satisfaction. The R2 value means that the regression modelexplained for 51.8% of data variance, while that of Nguyen et al. was lower with 40% and Tran et al. was higher with 66.7% [19,20]. Considering the t-test values were significantly (p>0.05) or no difference between male and women on how to perceive the factors in the study. The reliability factor of the service quality scale was significantly (p<0.05), confirming the difference in the perception of trust factors between male and female, in other words, this factor is more significant for the male population than for the female population. There are statistically significant differences among age groups in 6 over 7 factors, which are capacity, empathy, tangibility, reliability and responsiveness.
In which the group aged >45 years old has the highest perception of these six factors, otherwise the <20 years old group has the lowest perception. Besides, price factor does not have significant differences among age groups, the possible explanation as, customers always considered health is the top issue regardless of the age, customers just want to get healthy enough to live and work. There is a statistically significant difference among different education groups in the perceptions of responsiveness, capacity, price and satisfaction. On the other hand, there is no significant difference in the perception of empathy among the four groups of education. In the tangible factor and the reliability factor, the diploma group has the highest perception. As a cross-sectional study was conducted on the large sample size, which can be representative for HCMC, the strength of this study is to build the new scale that assesses customer satisfaction as well as service quality of GPP pharmacy. Moreover, statistical analyzes also indicate the factors that influence customer satisfaction to help pharmacies’ trader have a better business strategy.
Nevertheless, our study has some limitations that need to point out. Firstly, the collecting data process is more than a year, hence, may involve a changing in some factors, namely price, leading to possible deviation of the results associated with this factor. Additionally, for a particular study on the service quality of retail pharmacy sector, using the SERVQUAL scale is considered to be safe and feasible option, but to develop and possibly applied, it is necessary to have further research. One of the major directions is to develop a model for assessing the service quality based on the SERVQUAL and RSQS model. The reason is that this model was widely applied and have been proved in using to assess customer’s perception of service quality of retail sector [21].
Results
The study conducted an interview of 1,440 samples, data were screened, and discarded samples were not satisfactory. Finally, the study identified 1,156 samples as required, which were encoded and entered using SPSS software.
Study Sample Description
The results showed that the sample distribution among female customers was higher (63.1%). Customers between the ages of 20 and under 30 years old accounted for the largest share, with 61.7%, with the remaining 9.3% being under 20 years old and 5.6% over 45 years old. In addition, the number of bachelor’s degree represented a remarkable 73.1%. Moreover, only 3.9% of customers have a monthly income over 15,000,000 VND. Therefore, the proportion of customers who have a monthly income less than 15,000,00 VND are suitable for the fact situation in Viet Nam (Table 1).
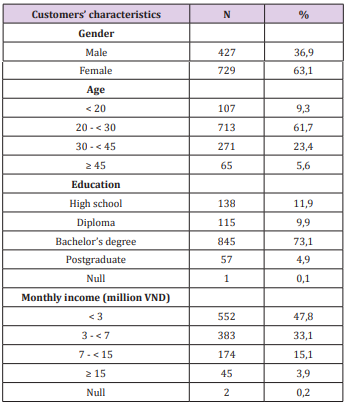
Table 1: Family practice office visits.
Evaluate the Service Quality and Customer Satisfaction Using Cronbach’s Alpha
The results show the Cronbach’s alpha claims a high reliability. However, due to the corrected item-total correlation of some variables less than 0.4, the study decided to eliminate these variables when performing EFA analysis including 05, 09, 13, 22, 31 and 34 (Table 2).
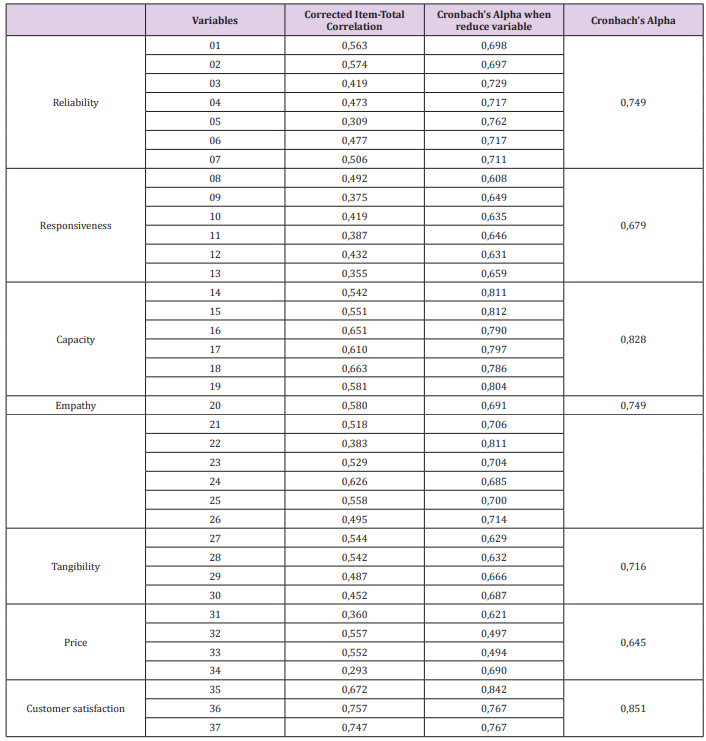
Table 2: Cronbach’s Alpha analysis of the components in the scale.
Evaluate the Service Quality and Customer Satisfaction Using EFA Analysis
After analyzing EFA, the official scale to estimate the service quality of the GPP pharmacy consist of 29 variables, namely: service quality (5 factors and 24 variables), price (1 factor and 2 variables) and customer satisfaction (1 factor and 3 variables). The service quality scale has a KMO value of 0.936 and the smallest eigenvalue is 1.02. Of these, 24 variables were collected in five factors, which accounted for 57,1% of data variance. Additionally, the price scale and customer satisfaction with a KMO value are respectively 0.649 and 0.714. They also account for 77.3% and 77.5% (price and customer satisfaction respectively) of the data variance. Besides, the results of all factors in Bartlett’s p-value are less than 0.001. This scale then was used to evaluate the relationship between service quality and price with customer satisfaction at GPP pharmacies in HCMC (Table 3).
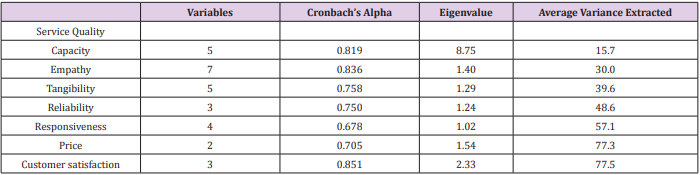
Table 3: Results of EFA analysis.
Analyze Factors Influencing and Assessing Customer Satisfaction with New Scales
From the regression analysis (Table 4), the relationship between the dependent variable (customer satisfaction) and 06 independent variables is shown in the following normalized regression equation:
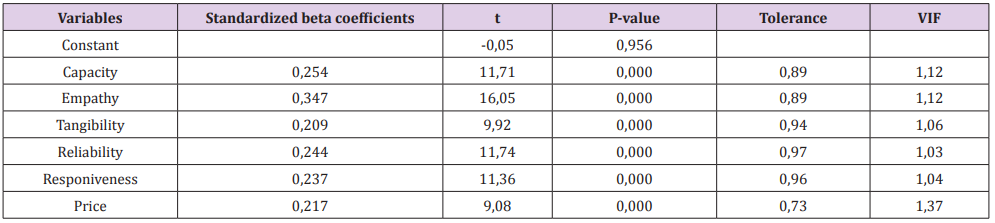
Table 4: Parameters of the regression.
Customer quality = 0,347Empathy + 0,254Capacity + 0,244Reliability +
0,237Responiveness + 0,217Price + 0,209Tangibility
Evaluation of the fit of the model through the results of R2 (0.521) and R2 adjust (0.518), this indicates the suitability of the model is 51.8% or in other words the model explains 51.8% variability of satisfaction is due to 6 independent factors. Validation of the model through the ANOVA show that the F parameter has a significance level of 0 in verification that the construction model is consistent with the data set collected. With a very trivial VIF (< 10) and a tolerance value greater than 0.0001, independent variables in the model are related to the dependent variable and no multicollinearity occur. The results of statistical analysis show that there is a difference between the five control variables (gender, age, educational level, monthly income and survey site) in the perception of the components of the scale service, price and satisfaction.
Customer Satisfaction
Overall customer satisfaction is an average of 3.73 (which is between 3.4 - 4.2) (Table 5). The p-test is 0.000 (<0.05), i.e., the average customer satisfaction value for GPP quality is significantly different 0. Thus, customers are still satisfied with the quality of GPP pharmacy services in Ho Chi Minh City.
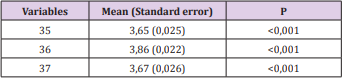
Table 5: Average value of customer satisfaction’s variables.
Conclusion
The result shows that customer satisfaction on service quality of HCMC pharmacies is satisfied and there six factors which affect this satisfaction, namely empathy, capacity, reliability, responsiveness, price and tangibility. Indeed, these factors need to be concerned with developing pharmacies’ satisfaction.
Acknowledgment
The authors apricate Vietnam Military Medical University and staffs of pharmacies in HCMC which facilitated the gathering data process.
References
- Lê TD (2013) Evaluating the performance of GPP pharmacies in the new districts of Hanoi for the period 2010-2012. Hanoi University of Pharmacy
- Ho Chi Minh city’s Health Department (2012) List of GPP pharmacies in Ho Chi Minh City.
- Villako P, Raal A (2007) A survey of Estonian consumer expectations from the pharmacy service and a comparison with the opinions of pharmacists. Pharm World Sci 29(5): 546-550.
- White L, Klinner C (2012) Service quality in community pharmacy: An exploration of determinants. Res Soc Adm Pharm 8(2): 122-132.
- Cronin JJ (2003) Looking back to see forward in services marketing: some ideas to consider. Manag Serv Qual Ann Int J 13(5): 332-337.
- Mahon PY (1996) An analysis of the concept ‘patient satisfaction’ as it relates to contemporary nursing care. J Adv Nurs 24(6): 1241-1248.
- Schneider B, Holcombe KM, White SS (1997) Lessons learned about service quality: What it is, how to manage it, and how to become a service quality organization. Consult Psychol J Pract Res 49(1): 35.
- Bogomolova S (2011) Service quality perceptions of solely loyal customers. Int J Mark Res 53(6): 793.
- Nazari M, Qaemi Divkolaei M, Bagheri Sorkhi M (2012) Prioritizing the Effective Factors to Customer’s Satisfaction. Int J Bus Manag 7(2): 236- 243.
- Bulajeva A (2010) Pharmaceutical care services and quality, a case study. University of Helsinki- Finland.
- Adil A, OF M Al Ghaswyneh, Albkour AM (2013) SERVQUAL and SERVPERF: A Review of Measures in Services Marketing Research Glob. J Manag Bus Res Mark 13(6): 64-76.
- Rahman MS, Khan AH, Mahmudul Haque M (2012) A conceptual study on the relationship between service quality towards customer satisfaction: Servqual and gronroos’s service quality model perspective. Asian Soc Sci 8(13): 201-210.
- Varki S, Colgate M (2001) The Role of Price Perceptions in an Integrated Model of Behavioral Intentions. J Serv Res 3(3): 232-240.
- Miller JA (1977) Studying satisfaction, modifying models, eliciting expectations, posing problems, and making meaningful measurements. Conceptualization Meas Consum Satisf dissatisfaction p. 72-91.
- Levy PS, Lemeshow S (2013) Sampling of populations: methods and applications. John Wiley & Sons.
- Bentler PM, Chou CP (1987) Practical Issues in Structural Modeling. Sociol Methods Res 16(1): 78-117.
- Baumgartner H, Homburg C (1996) Applications of structural equation modeling in marketing and consumer research: A review. International Journal of Research in Marketing 13(2): 139-161.
- Tse DK, Wilton PC (1988) Models of consumer satisfaction formation: an extension. J Mark 25: 204-212.
- Van Ngoc N, Duong NĐ (2012) Study on customer satisfaction of GPP standard pharmacies of Thanh Kieu Pharmaceutical Company. J Soc Sci Humanit 6: 60-67.
- Hien TT T, Van Ngoc N (2015) Evaluation of service quality of pharmacies in Khanh Hoa province. J Fish Sci Technol 2: 102-107.
- Anh PC, Ha NT, Minh NH (2013) Study on models of service quality assessment. J Sci Hanoi Natl Univ Econ Bus 29(1): 11-22.
