 Research Article
Abstract
Objective: To investigate the correlation between clinical indexes and 18F-FDG PET / CT parameters, as well as the prognostic value of 18F-FDG PET / CT parameters in limited-stage small cell lung cancer (LS-SCLC).
Methods: Sixty-six patients were retrospectively included in this study, who was diagnosed with LS-SCLC and underwent pretreatment 18F-FDG PET / CT scans. Student’s t test and Mann-Whitney U test were used to analyze the potential association between clinical indexes (age, gender, hydrothorax, site, type. Etc.) and PET/CT parameters (the SUVmax, the sum of metabolic volume (MTVsum), the sum of total lesions glycolysis (TLGsum)). Then receiver-operating characteristic (ROC) curve was plotted to estimate the threshold (cut-off point) of each parameter with Youden index in predicting prognosis. At last, Kaplan-Meier method and Log-rank test were used to perform univariate survival analysis and Cox proportional hazards model for multivariate analysis.
Results: SUVmax, MTVsum and TLGsum of all the 66 patients were 10.57 ± 3.27, 38.71 (2.89, 221.68) cm3 and 267.04 (11.67,1684.13) and all of them were associated with hydrothorax, the maximal tumor length, clinical stage and lactate dehydrogenase (LDH), respectively. MTVsum, TLGsum were also associated with tumor type and neuron specific enolase (NSE), independently. During the median follow-up of 33 months, 4 patients were lost to follow-up, 43 patients were progressive or recurrent with 12.30 months of median progression-free survival (PFS), and 38 patients were deceased with 15.75 months of median overall survival (OS). The optimal PFS cut-off point of SUVmax, MTVsum and TLGsum were 10.08, 16.18cm3 and 209.14, respectively. Univariate analysis showed that hydrothorax, the maximal tumor length, clinical stage, NSE, LDH, surgery, MTVsum and TLGsum were all associated with PFS and OS (all P <0.05). SUVmax was associated with PFS (HR = 2.15, 95% CI: 1.15 ~ 4.02, P = 0.017), but not with OS (HR = 1.82, 95% CI: 0.91 ~ 3.63, P = 0.017). Multivariate analysis demonstrated that NSE (HR = 3.83, 95% CI: 1.28 ~ 11.46, P = 0.016), LDH (HR = 4.46, 95% CI: 2.02 ~ 9.85, P = 0.000), MTVsum (HR = 9.26, 95 % CI: 3.79 ~ 24.62, P = 0.000) and TLGsum (HR = 3.87, 95% CI: 1.34 ~ 11.22, P = 0.013) were the independent predictors of PFS, and LDH (HR = 2.77, 95% CI: 1.22 ~ 6.30, P = 0.015), MTVsum (HR = 6.83, 95% CI: 1.46 ~ 15.89, P = 0.014) were also the independent predictors of OS. However, SUVmax was not the independent predictor of either PFS or OS (both P> 0.05).
Conclusion: 18F-FDG PET / CT imaging indexes were correlated with clinical parameters as well as survival time, which can be used to predict the prognosis of LSSCLC patients.
Keywords: Small cell lung cancer; Limited stage; 18F-FDG-PET/CT; Overall survival; Progression free survival
Introduction
Small cell lung cancer (SCLC) accounts for about 13% to 20% of lung cancer, with biological characteristics of rapid growth, strong invasion, early prone to blood metastasis and poor prognosis [1]. According to the Venterans Administration Lung Study Group (VALSG) staging system, SCLC is divided into limited-stage small cell lung cancer (LS-SCLC) and extensive-stage small cell lung cancer (ES-SCLC). If the tumor was confined to one side of the chest (including the lymph nodes draining in the area, for example homo-lateral hilar, mediastinal or supraclavicular lymph nodes) and can be incorporated into the same radiation field, it was LSSCLC; otherwise, it is ES-SCLC [2]. LS-SCLC patients have greater heterogeneity and larger differences in disease outcomes; therefore, early prediction of prognosis and proper management are currently becoming research hotspots. 18F-FDG PET / CT played a crucial role in the management of cancer patients owing to its value in tumor staging, differential diagnosis as well as in prediction of treatment response. Parameters of PET/CT, including SUVmax, the sum of metabolic volume (MTVsum) and the sum of total lesions glycolysis (TLGsum)), were commonly proposed for clinical diagnosis and prognostic assessment of oncology, including head and neck tumor [3,4], lymphoma [5], non-small cell lung cancer(NSCLC) [6,7], but their value in LS-SCLC has little literature supported. In this retrospective research, 18F-FDG PET / CT imaging and clinical data of 66 LS-SCLC patients were investigated. firstly, correlation between PET/CT parameters and clinical indexes was performed. Then, survival analysis was depicted to reveal the prognostic value of 18F-FDG PET / CT.
Materials and Methods
From April 2009 to December 2015, a total of 66 LS-SCLC patients with complete clinical data in our hospital were enrolled.
Inclusion Criteria
a) SCLC diagnosed by pathology;
b) All patients underwent pretreatment 18F-FDG PET / CT scans and brain MRI which conformed the disease in limited stage;
c) No other tumor-related treatment before PET / CT imaging;
d) No serious heart, liver, kidney and hematopoietic system diseases;
e) Patients with complete clinical data.
Exclusion criteria
a) Other pathological types of lung cancer (such as adenocarcinoma, squamous cell carcinoma, large cell carcinoma);
b) Extensive-stage small cell lung cancer;
c) Combined with other malignancies;
d) Non-disease-related death during follow-up.
66 patients including 58 males and 8 females, aged from 39 to 79 years old (median age 65 years old). According to TNM staging, 4 patients in IA, 4 patients in IB, 9 patients in IIA, 3 patients in IIB, 28 patients in IIIA, 18 patients in IIIB; all patients gave written and informed consent before the study.
PET/CT imaging and image analysis.18F-FDG was produced by MiniTrace cyclotron and Tracer Lab FX-FDG (GE Healthcare, USA) with purity ≥95%. PET/CT examinations were performed in Discovery ST PET/CT scanner (GE Healthcare, USA). All patients fasted for more than 6 h before 18F-FDG PET/CT scans. Their serum glucose level was controlled to lower than 11.1 mmol/l. Patients rested quietly for 60-70 min after injection of 18F-FDG (at a dosage of 3.70-5.55 MBq/kg). The whole-body CT and PET scans were acquired post voiding. First, low-dose non-enhanced CT images were scanned from the top of the skull to the mid-thigh, with bulb voltage 120 kV, current 140 mA, pitch 1.25mm and slice thickness 3.27 mm. Then, the PET data were acquired immediately after the CT scan using a three-dimensional acquisition mode at a speed of 2-3 min/bed (6-7 beds in total). CT Attenuation-corrected PET images were reconstructed using an ordered-subsets expectation maximization iterative reconstruction algorithm and then transverse, coronal and sagittal fusion images of PET and CT were analyzed on an Advantage Workstation (AW) using PET VCAR software (GE Healthcare, USA).
Metabolic tumor volume (MTV), which represents the tumor biological target volume, was measured [8] as the volume of interest (VOI) of hypermetabolic tissue with an SUV threshold of 3. then maximal standardized uptake value (SUVmax), the sum of MTV (MTVsum) and the sum of total lesion glycolysis (TLG) (TLGsum) were all recorded to be analyzed. In all 66 patients, 17 patients underwent surgery, including 4 cases without any postoperative treatment, 5 cases with postoperative chemotherapy and 8 cases with postoperative chemo-radiotherapy. In other 49 patients who did not receive surgery, 16 patients underwent chemotherapy alone, while 33 others received chemo-radiotherapy. In the 62 patients who received chemotherapy, the use of EP regimen (cisplatin and etoposide) in 40 cases and CE regimen (carboplatin + etoposide) in 22 cases were performed. In the 41 patients undergoing radiotherapy, either conventional radiotherapy or three-dimensional conformal radiotherapy were taken according to their disease.
Follow-ups were by telephone or outpatient service till July 1, 2016. Progression-free survival (PFS) and overall survival (OS) were recorded as evaluation indicators for survival. PFS denotes the time of staying free of disease progression after a treatment; OS indicates the length of time from either the date of diagnosis or the start of treatment for a disease that patients diagnosed with the disease are still alive. Data analysis was performed using SPSS 17.0 statistical software. First, normality test was used to determine the distribution of SUVmax, MTVsum and TLGsum: if normal distribution was detected, data represented as mean ± SD were analyzed using two independent samples t-test; otherwise,, data represented as the median (5th, 95 percent) [M (P5, P95)] were analyzed using the Mann-Whitney U non-parametric tests. Considering tumor recurrence or progression as a positive event, the receiver-operating characteristic (ROC) curve was plotted to obtain the optimal cutoff point of SUVmax, MTVsum and TLGsum. Survival analysis was calculated using the Kaplan-Meier univariate test and statistically evaluated using the log-rank test, as well as Cox proportional hazards model for multivariate analysis. P values less than 0.05 were considered statistically significant.
Results
Correlation of SUVmax, MTVsum, TLGsum with clinical factors. The SUVmax, MTVsum, TLGsum of 66 patients were 10.57 ± 3.27, 38.71 (2.89, 221.68) cm3, and 267.04 (11.67,1684.13), respectively. SUVmax, MTVsum, TLGsum were positively correlated (p<0.05) with pleural effusion existence, maximal diameter of tumor, clinical stage of TNM and level of lactate dehydrogenase (LDH). There was no significant difference (P=0.059) between SUVmax of patients with primary peripheral lung cancer and that of patients with central lung cancer, however, the MTVsum and TLGsum of the former were significantly lower than the latter (P <0.05). MTVsum and TLGsum were found higher (both P<0.05) in patients with elevated Neuron-specific enolase (NSE), while SUVmax showed no significant difference (P = 0.087) in NSE (Table 1). The follow-up results. After a median follow-up of 33 (7 to 86) months, 4 cases were lost; 43 cases were recurrent and progressive, the median PFS of which was 12.30 months and the 1 year, 3-year, 5-year PFS rate of which were 51.61% (32/62), 14.52% (9/62), 6.45% (4/62), respectively; 38 cases were deceased, the median OS (overall survival) of which was 15.75 months, and the 1 year, 3-year, 5-year OS rate of which were 70.97% (44/62), 22.58% (14/62), 8.06% (5/62), respectively.
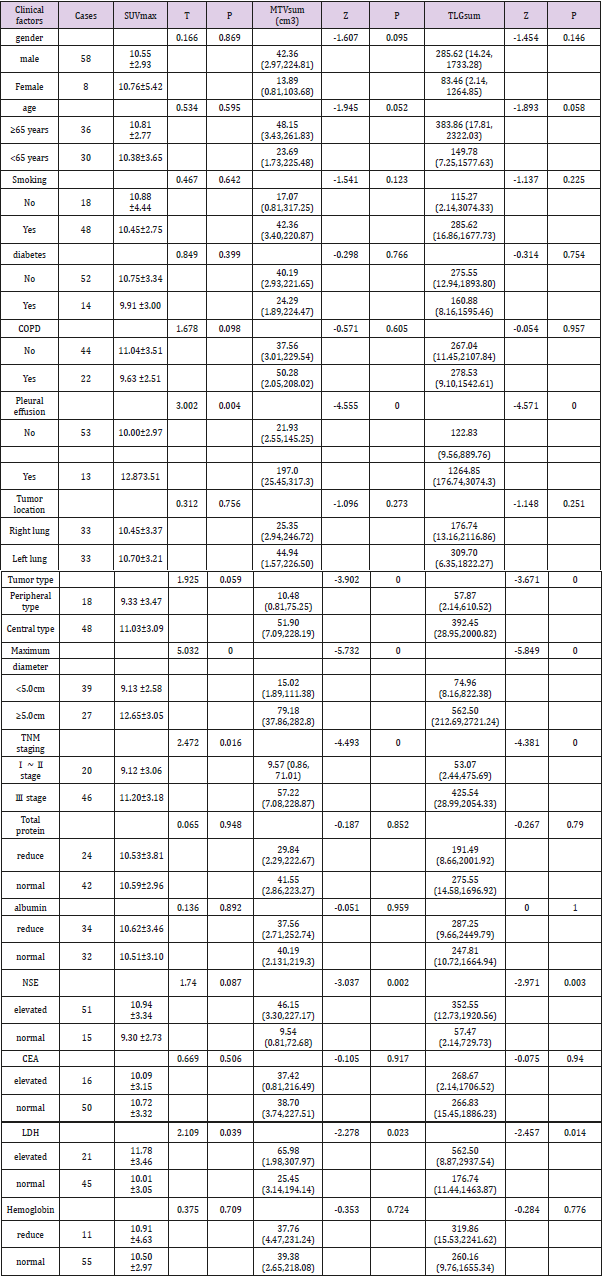
Table 1: Correlations of SUVmax, MTVsum, TLGsum with clinical factors in 66 LS-SCLC patients.
ROC curve results. Considering tumor recurrence or progression as a positive event, the ROC curve of SUVmax, MTVsum and TLGsum was plotted in Figure 1. The optimal cutoff values of SUVmax, MTVsum and TLGsum to predict PFS were 10.08, 16.18 and 209.14, respectively (Table 2). Results of univariate survival analysis. Univariate analysis showed that MTVsum and TLGsum were correlated with both PFS and OS in patients with LS-SCLC (all P<0.05), while the SUVmax was not correlated with OS (HR = 1.82, 95% CI : 0.91 ~ 3.63, P = 0.017) ,only with PFS (HR = 2.15, 95% CI : 1.15 ~ 4.02, P = 0.017). In addition to these metabolic parameters, clinical factors, including pleural effusion, maximum diameter of tumor, TNM stage, NSE, LDH, surgical method were all correlated with PFS and OS of patients (all P <0.05) (Table 3, Figure 2). On the contrary, gender, age, history of smoking, diabetes, COPD, tumor location, tumor type, total protein, albumin, CEA, hemoglobin, and radiotherapy were all irrelevant with PFS and OS of patients (all P >0.05).
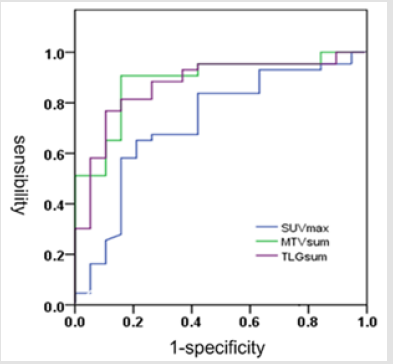
Figure 1: ROC curves of SUVmax, MTVsum and TLGsum.
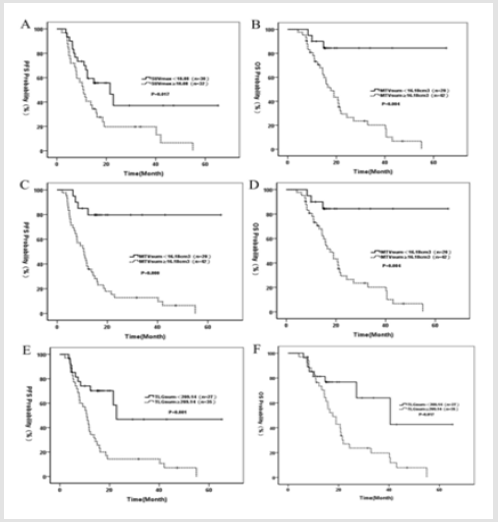
Figure 2: A. PFS curve of SUVmax;
B. OS curve of SUVmax;
C. PFS curve of MTVsum;
D. OS curve of MTVsum;
E. PFS curve of TLGsum;
F. OS curve of TLGsum.
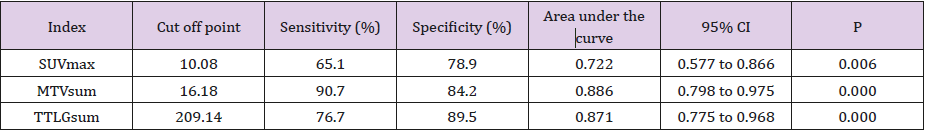
Table 2: ROC curve analysis of SUVmax, MTVsum, TLGsum in PFS analysis.
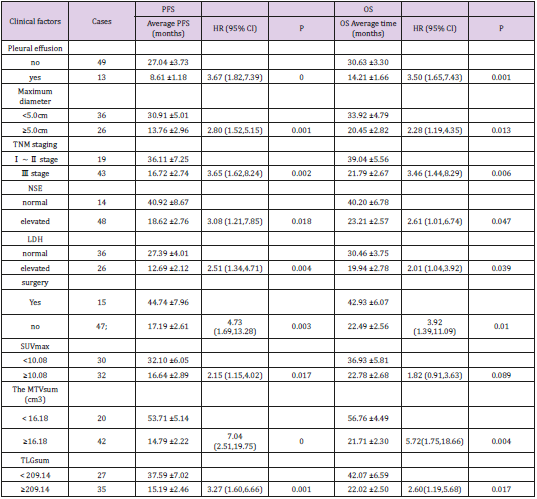
Table 3: Univariate survival analysis in 62 LS-SCLC patients.
Results of multivariate prognostic analysis. Taking those factors that were statistically significant in univariate analysis as variables to apply into COX proportional hazard model, the multivariate prognostic analysis revealed (Table 4) that NSE (HR = 3.83, 95 % CI: 1.28 ~ 11.46, P = 0.016), LDH (HR = 4.46, 95% CI: 2.02 ~ 9.85, P = 0.000), MTVsum (HR = 9.26, 95% CI: 3.79 ~ 24.62, P = 0.000) and TLGsum (HR = 3.87, 95% CI: 1.34 ~ 11.22, P = 0.013) were all independent predictors of PFS in LS-SCLC patients; LDH (HR = 2.77, 95% CI: 1.22 ~ 6.30, P = 0.015), MTVsum (HR = 6.83, 95% CI: 1.46 ~ 15.89, P = 0.014) were independent predictors of OS. In addition, SUVmax was not independent predictor of either PFS or OS (all P>0.05).
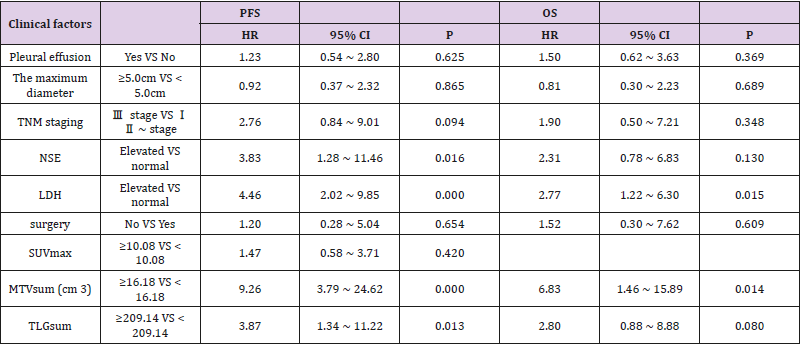
Table 4: Multivariate survival analysis in 62 LS-SCLC patients.
Discussion
SCLC is neuroendocrine neoplasm, with high malignity and invasion. Distant metastases are often observed in about twothirds of patients who were diagnosed with SCLC. Despite its high sensitivity to radio-chemotherapy and high clinical remission rate, SCLC is prone to relapse and metastasis, resulting in very poor prognosis with only 5%-15% of 5-year survival rate as reported [9- 10]. In our study, the 1-year, 3-year and 5-year survival rates were 70.97% (44/62), 22.58% (14/62), 8.06% (5/62), respectively, consistent with the above literature. 18F-FDG PET / CT as a hybrid functional-anatomical imaging is widely applied in diagnosis, staging, prognosis and response evaluation of tumor, especially in lung cancer. Several studies [11-13] suggested that SUVmax, MTV and TLG from 18F-FDG PET / CT imaging of NSCLC have good correlation with many clinical factors such as TNM staging, pathological grading and serum tumor markers, etc. But the relationship between the PET metabolic parameters and clinical factors of SCLC is rarely reported.
The results of this study showed that SUVmax, MTVsum and TLGsum were significantly higher (all P <0.05) in patients with existence of pleural effusion, larger tumors, high TNM stage and elevated LDH, suggesting that the tumor has high metabolic activity, vigorous growth, large tumor burden and strong invasion. There was no significant difference (P=0.059) between SUVmax measurement in patients with primary peripheral lung cancer and that of central lung cancer, however, the MTVsum and TLGsum of the former were significantly lower than the latter (both P <0.05). The result is like the literature of Nobashi et al. [14]. In addition, we found that the level of NSE was correlated with both MTVsum and TLGsum other than SUVmax. It has been reported [15,16] that NSE decreased with the lesion volume of SCLC, as a result, NSE was correlated with tumor burden. SUVmax only represented the metabolic activity of some tumor tissue, while MTV and TLG reflected the tumor burden. It might explain why both MTVsum and TLGsum have better correlation with clinical factors rather than SUVmax in our study.
In recent years, targeted therapy for NSCLC had been developed rapidly. On the contrary, the research progress of new drug for SCLC is slowing down. The recent research hotspot is the prognosis predictor for SCLC. Though there are many prognostic factors such as gender, age, weight loss, performance status, comorbidities (diabetes, COPD, etc.), smoking, tumor size, serum tumor markers (NSE, CEA, etc.), LDH, TNM staging, radio-chemotherapy regimen and so on, few can be clinically recognized as prognostic predictor. As a mature imaging technology, the application of 18F-FDG PET / CT in SCLC still have considerable controversy. Go et al. [17] analyzed prognostic factors on 145 cases of SCLC (61 LS-SCLC and 84 ES-SCLC) and suggested that gender, efficacy, TNM staging, the number of lesions and the SUVmax were independent predictor of PFS, besides, only SUVmax was an independent risk factor of OS. In study of Inal [18], difference of OS between SUVmax ≥ 12.9 group and SUVmax <12.9 group was not statistically significant (P = 0.66).
All these studies above only considered the value of SUVmax rather than MTV and TLG in prognosis prediction. In a retrospective research of 55 18F FDG PET/CT SCLC, Zer et al. [19] revealed that MTV and TLG of the primary tumor was not statistically significant for OS (p = 0.3) or PFS (p=0.2). MTVsum of all lesions was statistically significant for PFS, but not for OS; TLGsum was statistically significant for OS, but not for PFS. Both SUVmax of primary lesion and that of the largest lesion were not statistically significant for prognosis. The study Ong et al. [20] also shows that MTV and TLG of the primary tumor were not statistically significant for prognosis. However, in the study of Kwon et al. [21], univariate analysis showed that SUVmax, MTVsum, TLGsum were all significant for PFS and OS, and multivariate analysis showed that MTVsum and SUVmax were independent predictors of PFS and OS, respectively. In our study, univariate analysis showed that MTVsum and TLGsum were correlated with both PFS and OS in patients with LS-SCLC, while the SUVmax was not correlated with OS but only with PFS. Multivariate analysis showed that MTVsum was independent predictors of both PFS and OS; TLGsum was independent predictors of PFS, regardless of OS; SUVmax was not independent predictor of either PFS or OS. Though the results were not consistent with that has been reported, explanations were included:
a) SUV values might be affected by many factors, such as blood glucose levels in patients, dose of 18F-FDG and its blood clearance rate, time interval from Injection of drugs to scan, resulting in inconsistent results of the analysis;
b) SUV thresholds used for PET/CT-based MTV segmentation algorithms were different, that were 42% of SUVmax in Zer et al. [19], 2.5 in Kwon et al. [16], and 3.0 in our study. Therefore, whether different thresholds for segmentation will affect the prognostic result of MTV as well as TLG was pending for further study;
c) As in this study 74.24% (49/66) of patients did not undergo surgery, some benign lymph nodes with high 18F-FDG uptake in mediastinal and hilar area were not able to be differentiated from the metastasis, resulting in overestimation of MTVsum and TLGsum;
d) Different TNM staging and treatment regimens were also responsible for inconsistent results.
In the studies of [17-19], patients with both LS-SCLC and ESSCLC were involved. However, in our study, only patients with LSSCLC were enrolled. In addition, [20,21] only investigated the PET metabolic parameters of the primary tumor in patients with LSSCLC. In our study, the MTV and TLG of primary lesion were not considered, as the primary lesion of SCLC is usually small and not easy to delineate. Moreover, taking only MTV of primary lesion into account may underestimate the tumor burden. All these issues might lead to inconsistent results with other literatures. In view of the above limitations, recently the use of texture analysis of PET/CT images for quantification of intra-tumor uptake heterogeneity has received increasing attention especially in prognostic prediction of lung cancer. Using information extracted form PET images, in addition to traditional quantitative indicators such as SUV, MTV and TLG, the tumor textural parameters including heterogeneity and homogeneity were analyzed.
In a retrospective research of 63 patients with newly diagnosed NSCLC, Lovinfosse et al. [22] found that SUVmax, SUVmean, MTV, TLG were all not associated with prognosis, while PET-derived tumor heterogeneity was independent prognostic predictor of PFS. Further investigations of textural analysis are expected. Besides, except for metabolic parameters of PET imaging, the clinical factors such as NSE and LDH were independent prognostic predictors for patients with SCLC, that was consistent with literatures [23- 24]. Limitations of this study were relatively small sample size, retrospective design and that 74.24% (49/66) of cases were biopsyproven, since not all patients are suitable for needle aspiration procedure. In conclusion, firstly, MTVsum and TLGsum had better correlation with clinical factors compared to SUVmax. Secondly, PET parameters have prognostic values in LS-SCLC patients. At last, MTVsum and TLGsum were both independent predictors of PFS, also MTVsum was independent predictors of OS.
References
- Cesare Gridelli, Francesca Casaluce, Assunta Sgambato, Fabio Monaco, Cesare Guida (2016) Treatment of Limited-stage Small cell lung cancer in the elderly, chemotherapy vs. sequential chemoradiotherapy vs. concurrent chemoradiotherapy: that’s the question. Transl Lung Gt Res 5(2): 150-154.
- Guoqin Qiu, Xianghui Du, Xia Zhou, Wuan Bao, Lei Chen, et al. (2016) Prophylactic cranial irradiation in 399 patients with limited-stage small cell lung cancer. Oncol Lett 11(4): 2654-2660.
- Differding S, Hanin FX, Grégoire V (2015) PET imaging biomarkers in head and neck cancer. Eur J Nucl Med Mol Imaging 42(4): 613-622.
- Picchio M, Kirienko M, Mapelli P, Dell’Oca I, Villa E, et al. (2014) Predictive value of pre-therapy 18F-FDG PET/CT for the outcome of (18)F-FDG PETguided radiotherapy in patients with head and neck cancer. Eur J Nucl Med Mol Imaging 41(1): 21-31.
- Meignan M, Itti E, Gallamini A, Younes A (2015) FDG PET/CT imaging as a biomarker in lymphoma. Eur J Nucl Med Mol Imaging 42(4): 623-633.
- Vaidya M, Creach KM, Frye J, Dehdashti F, Bradley JD, et al. (2012) Combined PET/CT image characteristics for radiotherapy tumor response in lung cancer. Radiotherapy & Oncology 102(2): 239-245.
- Oh JR, JH SEO, A chong, Min JJ, Song HC, et al. (2012) Whole-body metabolic Tumour Volume of 18F-FDG of PET / CT Improves Prediction of Prognosis in at The Small Lung Cancer. Eu J Nucl MoI Imaging 39(6): 925-935.
- Belani CP, Dahlberg SE, Rudin CM, Fleisher M, Chen HX, et al. (2016) Vismodegib or cixutumumab in combination with standard chemotherapy for patients with extensive-stage small cell lung cancer: A trial of the ECOG-ACRIN Cancer Research Group (E1508). Cancer 122(15): 2371-2378.
- Wei Jiang, Nan Bi, Wen-Jue Zhang, Li-Hong Wu, Li-Pin Liu, et al. (2016) MicroRNA-related polymorphisms in apoptosis pathway genes are predictive of clinical outcome in patients with limited disease small cell lung cancer. Oncotarget 7(16): 22632-22638.
- Wang SY, Zhang J, Sun GF (2013) The maximal standardized uptake value of 18F-FDG PET / CT combined with imaging features on high resolution CT for the diagnosis of lung cancer. Chin J Nucl Med Mol Imaging 33(1): 29-33.
- Wang SY, Zhang J, Sun GF (2013) The maximal standardized uptake value of 18F-FDG PET / CT combined with imaging features on high resolution CT for the diagnosis of lung cancer. Chin J Nucl Med Mol Imaging 33(1): 29-33.
- Dogan I, Savas Karyagar, Sevda Saglampinar Karyagar, Cemil Kahraman, Ahmet Alver (2014) Relationship between pretreatment levels of serum Cyfra 21.1, CEA and PET metabolic parameters in NSCLC. Ann Nucl Med 28(9): 829-835.
- Liu DJ, Feng YL, Yu FW (2010) The effect of histotype and histodifferentiaton on the standardized uptake value of non-small lung cancer 18F-FDG PET / CT imaging. Chin J Nucl Med 30(1): 5-9.
- Tomomi Nobashi, Sho Koyasu, Yuji Nakamoto, Takeshi Kubo, Takayoshi Ishimori, et al. (2016) Prognostic value of fluorine-18 fludeoxyglucose positron emission tomography parameters differs according to primary tumour location in small-cell lung cancer. Br J Radiol 89(1059): 1-12.
- Shi P, Meng X, Ni M, Sun X, Xing L, et al. (2015) Association or the Between metabolic serum tumor markers and tumor lesion Glycolysis Total Volume or patients in the with Recurrent Small Cell Lung Cancer. Oncol Lett 10(5): 3123-3128.
- Buil-Bruna N, López-Picazo JM, Moreno-Jiménez M, Martín-Algarra S, Ribba B, et al. (2014) A population pharmacodynamic model for lactate dehydrogenase and neuron specific enolase to predict tumor progression in small cell lung cancer patients. AAPS J 16(3): 609-619.
- Go SI, Song HN, Kang JH, Kang MH, Kim MJ, et al. (2014) The Clinical Impact of the Sum of the Maximum Standardized Uptake Value on the Pretreatment with 18F-FDG-PET/CT in Small-Cell Lung Cancer. Oncology 86(1): 1-9.
- Inal’s A, M Kucukoner, MA Kaplan (2013) 18F. FDG-of PET / CT prognostic Factor for Survival in patients the with the Cell Lung Cancer Small? Single Center Preference Experience. Rev Port Pneumol 19 (6): 260-265.
- Zer A, Domachevsky L, Rapson Y, Nidam M, Flex D, et al. (2015) The Role of 18F-FDG PET/CT on Staging and Prognosis in Patients with Small Cell Lung Cancer. Eur Radiol 26(9): 3155-3161.
- Ong LT, Dunphy M, Foster A, Woo KM, Zhang Z, et al. (2016) Prognostic Value of Pre-radiotherapy 18F-FDG PET/CT Volumetrics in Limited-Stage Small-Cell Lung Cancer. Clin Lung Cancer 17(3): 184-188.
- Kwon SH, Hyun SH, Yoon JK, AN YS, Oh YT, et al. (2016) The Highest Metabolic Activity on FDG PET Is Associated with Overall Survival in Limited-Stage Small-Cell Lung Cancer. Medicine (Baltimore) 95(5): e2772.
- Lovinfosse P, Janvary ZL, Coucke P, Jodogne S, Bernard C, et al. (2016) FDG PET / CT texture Analysis For predicting the outcome of Lung cancer treated by stereotactic body radiation therapy. Eur J Nucl Med Mol Imaging 43(8): 1453- 1460.
- Zhang X, Guo M, Fan J, Lv Z, Huang Q, et al. (2016) Prognostic significance of serum LDH in small cell lung cancer: A systematic review with metaanalysis. Cancer Biomark 16(3): 415-423.
- Wang X, Jiang R, Li K (2014) Prognostic significance of pretreatment laboratory parameters in combined small-cell lung cancer. Cell Biochem Biophys 69(3): 633-640.
