 Research Article
Abstract
The study assessed the use of food security measures as proxy indicators of nutritional status in rural and urban households of Ikwuano LGA, Abia state. A multi-stage sampling technique was used in the selection of 150 urban and 120 rural households. Mother-child pairs were used in the study. Household food security was measured with the Household Food Insecurity Access Scale (HFIAS), Household Hunger Scale (HHS) and the Household Dietary Diversity Score (HDDS). Demographic, socioeconomic and other relevant data were collected. Weight, height and Mid-upper arm circumference were measured for children (<60 months) and their mothers. Data was presented in frequencies, percentages, means and standard deviations. Person Correlation was used to relate the household food security measures and nutritional status of the children. Results showed mean age of mother and child was 35.57 years and 34 months respectively. Mean body mass index (BMI) of mothers was 27.11 Kg/m2. Households with poor dietary diversity/food insecure households have greater prevalence of severe and moderate underweight (6.89% and 14.94%) than food secure households (5.78% and 9.24%) using HFIAS. Households with severe hunger had a greater percentage of severely underweight children (7.44%) than households with little to no hunger (6.12%) using HHS.
It also shows that 7.8% each of food secured households have children that are severely and moderately underweight respectively using HDDS. Cross analysis results indicate that the severe forms of nutritional problems were more prevalent in food secure households than food insecure households. This demonstrates the urgent need for the implementation of nutrition education, together with other intervention strategies to actualize the Sustainable Development Goals.
Keywords: Food Security; Proxy Indicators; Nutritional Status; Households; Nigeria
Introduction
The world continues to face major challenges in achieving food security. Food security is one of the targets of the Sustainable Development Goals and is widely considered as an important measure for evaluating the progress of a country in terms of wellbeing [1]. Despite various concerns by Governments all over the world on ensuring that every household can at least provide three square meals for their family, food insecurity continues to be a major development problem across the globe, undermining people’s health, productivity, and often their very survival [2]. Global hunger is severe, as nearly 30 per cent of the world’s population is currently suffering from one or more forms of malnutrition, including inadequate caloric consumption, protein deficiency, poor dietary quality and micronutrient deficiency. Recent statistics indicate that malnutrition, in all its forms, is still a leading cause of infant and maternal death. The FAO [3] estimates that about 795 million people of the 7.3 billion people in the world, or one out of nine people worldwide, were suffering from chronic undernourishment in 2014. Almost all the hungry people- 780 million, live in developing countries. This implies that about 11 million of undernourished people live in developed countries [3].
According to the UNICEF in 2009, in Nigeria, over one-third of child deaths are due to under nutrition and increased severity of disease. Undernourished children are at high risk of impaired physical and cognitive development, adversely affecting a country’s growth and productivity [4]. Nigeria also has the second highest absolute number of children who are stunted globally [5]. The results showed, 36% of under-five children are stunted, 23% are underweight and 14% are wasted in Nigeria [5]. The Food and Agriculture Organisation [6] monitoring report on progress towards hunger reduction targets of the World Food Summit (WFS) and the Nigeria Millennium Development Goals (MDGs) indicate that there was slight increase in per capita daily calorie intake of Nigerians. Despite the improved statistics, Nigeria still continues to face challenges in ensuring food security and meeting the basic food needs of its population. The World Food Summit of 1996 as cited in the FAO report of 2014 defines food security as a situation that exists “when all people, at all times have physical, social and economic access to sufficient, safe and nutritious food that meets their dietary needs and food preferences for an active and healthy life”.
This definition essentially emphasizes the idea and concept of food security. Indeed, food security is necessary to maintain an optimal nutritional status, and core to its definition is the requirement for nutritious food, which refers not only to sufficient quantities of food (in terms of calories), but also to sufficient quality (in terms of variety and micronutrient content). Hence, the absence of any component of the above, including cultural acceptability of food, social accessibility to resources, stability of food availability, access or utilization results in food insecurity and thus in the long run, a decline in nutritional status [7]. Food security is hinged on four dimensions namely- food availability which entails the physical existence and sufficient quantities of food of appropriate quality are available; food accessibility which entails having sufficient resources to obtain appropriate food in sufficient quality, quantity and diversity for a nutritious diet; food use/utilization which entails appropriate use based on the knowledge of nutrition and food combinations and nutrition habits, as well as hygiene and adequate water to meet all physiological needs and; food stability/ vulnerability which entails that a given population, household or individual must have access to adequate food at all times, without unprecedented fluctuations [8,9]. For such stability to occur, they should not risk losing access to food as a consequence of sudden shocks such as an economic or climatic crisis or cyclical events such as seasonal food insecurity [10].
Agricultural production was the mainstay of Nigeria’s economy and a source of food. In the colonial era and briefly after independence, agriculture played a dominant role in the nation’s economy from the standpoint of adequate food for its population until the discovery of oil in commercial quantities [11]. Today, domestic food production is on the rise in Nigeria, but it is not enough to meet the national food demand. Worse still, losses of produced crops are on the rise because processing and storage of crops are poorly done. Nutritious foods are limited by low income, poverty-stricken citizens and ignorance on food utilization; most nutritious foods are often expensive while food intake and nutritional wellbeing of many households is of relatively low quantity and is affected by their low economic status. According to [12], households’ food insecurity, under nutrition and micro nutrient deficiencies are found throughout Nigeria. This insidious trend creates a challenge to food security in many communities in Nigeria. Hence, it becomes fundamental that in the development of a nation, its food security must be an important consideration as well as its agricultural production. Most households in Nigeria, especially in rural areas, are food insecure and their nutritional status poor.
Methods
Study Design and Population
A descriptive and comparative survey design was used in this study. The sample population consisted of households in Okwe and Umudike communities of Ikwuano LGA. The participation criteria of households having a child at or below five years of age, and a mother or primary care-giver (one who prepares the meals and eats together at least four times a week) was used. Umudike has an estimated 500 households while Okwe Ukwu has about 400 households [11]. The total population is about 900 households. The sample size consists of 30% of households in each community that meets the defined requirement. Mother/primary caregiver-child pairs in the selected 270 households were used in the study.
Sampling Technique
Multi-stage sampling technique was employed. Firstly, two (2) communities were selected from the twenty-eight (28) communities in Ikwuano LGA. Of these, 120 and 150 households, in the rural and urban area respectively, who met the inclusion criteria, were selected. The inclusion criterions were that the selected household must have Mothers/Primary caregiver who was not pregnant, sick or bedridden and a child less than five years of age. First, Umudike is not only an urban community but has a large major market and a university; therefore, Umudike was considered to explore the role it plays as households’ food source. Secondly, the two communities are centrally situated in Ikwuano LGA and therefore would produce reliable data about household food insecurity from two central points in the LGA. Mothers/Primary caregivers will be purposively selected as key informants because they possess vital information concerning household food insecurity as well as their nutritional status and that of their children. Information concerning food security, food availability, accessibility and utilization, nutritional pattern and consumption will be reflected in the questionnaire to be filled by respondents in the area. A child below 5 years of age from each household was selected randomly (if there is more than a child) for nutrition assessment using three selected measures of anthropometry.
Survey Implementation
The survey implementation plan followed a series of planning and execution of survey activities. This entailed visiting the local authorities to obtain permission, selection of participating households and training of research assistants. Permission to conduct the survey was obtained from the local autonomous community leaders of the two communities known as the Igwe. The purpose and methods used during in the research was explained for thorough understanding. This was to ensure a hitch-free survey. This definition of a household was used for the sake of the study ‘A household consists of a person or group of persons living together usually under the same roof or in the same building / compound, who share the same source of food, eat together at least four (4) times a week and recognize themselves as a social unit with a head of household’. These 270 households were divided among research trainee teams as they proceed in order to achieve an objective balance in the study. All households respective to presence of child under five years was included in the selection.
The primary caregiver in selected households includes the mother or the person who prepares the family meals. Even though the mother/primary caregiver was issued the questionnaire to be filled and their children assessed, initial consent was first sought from the head of the family, the father, where he was present. When this was done, the primary caregiver/mother’s consent was also sought for onward administration of the questionnaire. To identify the missing household members, every qualified household that was missed was identified and revisited unless logistic constrains or security issues hindered the researcher from doing so. If members of a selected household are absent after two attempts, are not comfortable with answering the survey questions or do not consent to being used during the study period, then that household was replaced by other households with similar characteristics available in the same cluster and showing requisite willingness. Participation of households in this exercise was purely a voluntary choice of each household. In an effort to standardize the survey process, a guide was prepared to explain the codes to be used and how each question should be asked to elicit the proper response. The research team (including the research assistants) was given the requisite training and experience on appropriate measurement techniques needed to conduct the anthropometric measurements also.
Data Collection
Pretested and self-administered questionnaires were used to collect information on the food availability, accessibility, utilization and stability of selected households. It also collected data on the demographic, socio-economic characteristics and dietary patterns of the study households. The questionnaire is divided into three sections structured after the three measurements of food security to be used. Data on household food insecurity measures (Household Food Insecurity Access Scale (HFIAS), Household Hunger Scale (HHS) and Household Dietary Diversity Score (HDDS) was collected. However, while the questionnaires were administered in English language, participants who could neither read, write or do not understand the language were assisted in filling the questionnaire and the researcher, in some cases, had to adopt the native Igbo language (most suitably the dialectical tongue of the indigenes, Oboro) or the Nigerian Pidgin English to explain the questionnaire to the participants. Ten research assistants were trained to assist for the data collection. The survey was carried out in April 2016 and lasted for a period of one month. Anthropometric data was also collected. Information such as height, weight and mid-upper arm circumference of both mother and children were collected using standard procedures so as to deduce information of their nutritional status.
Instruments for Measurement
The instruments for measurement include the Household Food Insecurity Access Scale (HFIAS) questionnaire and Household Dietary Diversity Score (HDDS) questionnaire to measure food security; the weighing scale which was used to take weight measurements, measuring rod or scale for height measurements, non-stretch tape measure or a cloth tape measure for mid-upper arm circumference (MUAC) measurements.
Household Food Insecurity Access Scale (HFIAS): This scale measures food insecurity using experience as a construct. The HFIAS questions were asked of the mother with respect to her experience of food security with a recall period of four weeks (30 days). There are nine occurrence and frequency-of-occurrence question pairs measuring the perception or experience of food insecurity with a focus on quantity of food accessed. The respondent was first asked an occurrence question – that is, whether the condition in the question happened at all in the past four weeks (yes or no). If the respondent answers “yes” to an occurrence question, a frequencyof- occurrence question is asked to determine whether the condition happened rarely (once or twice), sometimes (three to ten times) or often (more than ten times) in the past four weeks. If the respondent answers “no”, the frequency of occurrence question is skipped. All of the occurrence questions ask whether the respondent or other household members either felt a certain way or performed a particular behaviour due to a certain food security situation over the recall period [13]. The HFIAS occurrence questions relate to three different domains of food insecurity (access) namely anxiety and uncertainty about the household food supply, insufficient quality (including variety and preferences of the type of food), and insufficient food intake and its physical consequences [13].
Household Dietary Diversity Score (HDDS): The HDDS consists of a list of 12 food groups/categories that a household might eat in a typical 24-hour period. The respondent was asked to respond for herself; which was considered to be an accurate response that can be used as a proxy for the household. The scale yields a score between zero and 12, with 12 indicating the greatest dietary diversity Table 1.
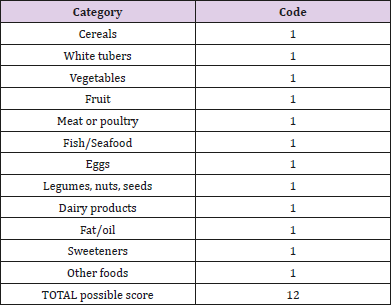
Table 1: Food categories and scoring in the Household Dietary Diversity Score (HDDS) [13].
Household Hunger Scale (HHS): This scale measures food insecurity using hunger as a construct. The hunger scale contains 8 questions and 2 sub-questions that indicate the frequency of occurrence. The HHS includes the final three yes/ no questions and the accompanying frequency question from the HFIAS. The respondents were also asked these questions using a recall period of 30days/4 weeks. The score yielded on the scale describe categorically if a household has ‘little or no hunger in the household,’’ “moderate hunger in the household,” or “severe hunger in the household”. The standards of [14].
Anthropometric Measurements
Weight Determination
The weight of each child was measured using a weight scale placed on a flat surface for balance. The weight was measured and recorded twice with no or minimum clothing and no shoe or stockings. The average of the two readings were taken and recorded. The weighing scales were carefully adjusted to zero after each weighing prior to the next measurement for accuracy. The readings were taken, and weight recorded to the nearest 0.1kg. The weight of the mother was also taken using a spring scale.
Height Determinations
Height/length of children 0-60 months were measured lying down (for infants 0-24 months) and standing (for children 25-60 months) with portable locally constructed length measuring rod. The standard procedure of [15] was applied. The heights of children were measured with no shoe, on a flat board with a measuring rod marked in centimeters. The infant who could not yet stand was measured with a measuring tape while the mother carried him/ her. It was taken into consideration that the baby be completely stretched out while measuring its length to ensure accurate measurement; the knees were pressed down and the hands by the side, the head and neck were also well adjusted so to make the child look up. A measuring rod or scale was used to take the height of the mother.
Mid-Upper Arm Circumference Determination
An arm circumference non-stretch tape graduated in centimetres was used to measure the mid upper arm circumference of the child and mother. The midpoint of the upper arm is found between the point of the shoulder and the point of the elbow. The tape measured the length of the shoulder to the elbow and the value obtained was divided by two, to obtain mid upper arm circumference of the child. The end of the tape “0” cm mark was put on the midpoint of the upper arm, the tape put around the arm so that it fits closely but not so tight that it makes folds on the skin. The values were recorded at where the “0” cm met the tape and precision was taken to 1cm MUAC and recorded as the child’s mid upper arm circumference. The same procedure was applied for the mother’s readings Table 2. These anthropometric measurements enable the researcher to determine such nutritional effects as childhood stunting, childhood wasting, childhood underweight and overweight and maternal overweight and obesity. The BMI values of the women were calculated using the formula: weight in kg divided by the square of height in meters to produce a unit measurement of kg/m2 and classified according to the BMI category Table 3.
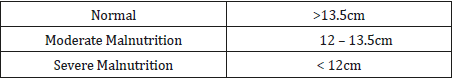
Table 2: MUAC in Children (12 – 60 months).
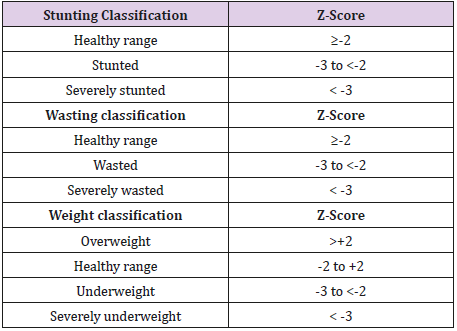
Table 3: WHO Stunting Classification for Children <Five Years of Age. Source: [16]
The BMI values of the women were calculated using the formula: weight in kg divided by the square of height in meters to produce a unit measurement of kg/m2 and classified according to the BMI category. Table 4 showed the relationship between underweight (UW), Stunting and Wasting in children and Household Food Insecurity Access Scale (HFIAS). It shows 7.8% each of food secured households have children that are severely and moderately underweight respectively. About 22% of food secured households have mildly underweight children and 3.13% have children that are overweight. Comparatively however, the prevalence of food secure households with severely underweight children (7.8%) is greater than the food insecure households (4.71%). Table 5 It also shows that the degree of severe and moderate stunting in food secure households (34.38% and 15.62% respectively) is greater than in food insecure households (24.52% and 13.21% respectively). Mild stunting was found to be higher in severely food insecure households (25.47%) as compared with the food secure households (17.19%). The prevalence of severe wasting was found to be greater in food secure households (4.68%) than in food insecure households (1.88%). Moderate and severe wasting was found to be more prevalent in severely food insecure households (7.54% and 13.20%) than food secure households (6.26% and 10.94%).

Table 4: WHO Stunting Classification for Children <Five Years of Age. Source: [16]
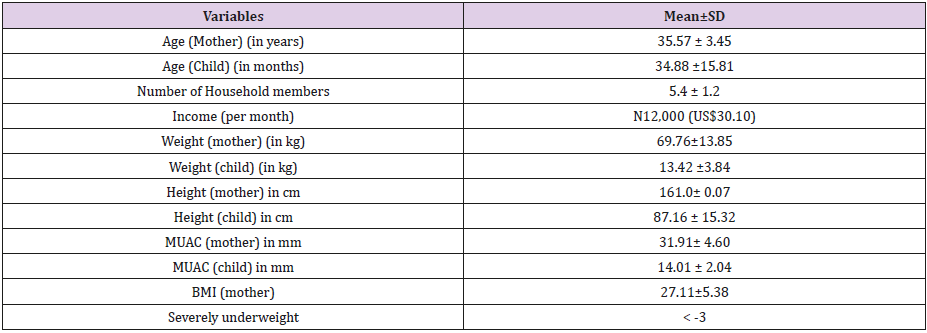
Table 5: Background information of the respondents.
Table 6 shows the relationship between underweight (UW), Stunting and Wasting in children and Household Dietary Diversity Score (HDDS). Households with poor dietary diversity/ food insecure households have greater prevalence of severe and moderate underweight (6.89% and 14.94%) than food secure households (5.78% and 9.24%). However, greater incidence of mild underweight was found in food secure households (23.12%) as well as up to 4.04% of overweight [16]. It also indicates that severe stunting was found to be more prevalent in food secure households (31.79%) than in food insecure households (25.28%). However, moderate and mild stunting had higher incidence in food insecure households (16.09% and 21.84% respectively). Mild wasting however was found to be more prevalent in food secure households (11.56%). Table 4 showed the relationship between underweight (UW), Stunting and Wasting in children and Household Hunger Scale (HHS). Households with severe hunger had a greater percentage of severely underweight children (7.44%) than households with little to no hunger (6.12%) Table 7.
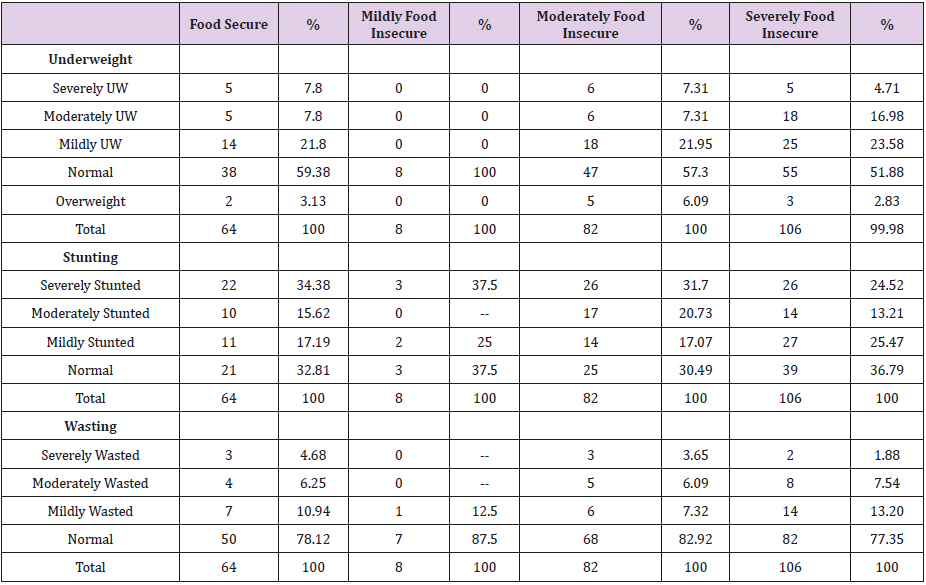
Table 6: Relationship between underweight (UW), Stunting and Wasting in children and Household Food Insecurity Access Scale (HFIAS).
Underweight - x2 = 19.746, df = 18, p = 0.347
Stunting - x2 = 21.426, df = 18, p = 0.258
Wasting - x2 = 13.063, df = 24, p = 0.965
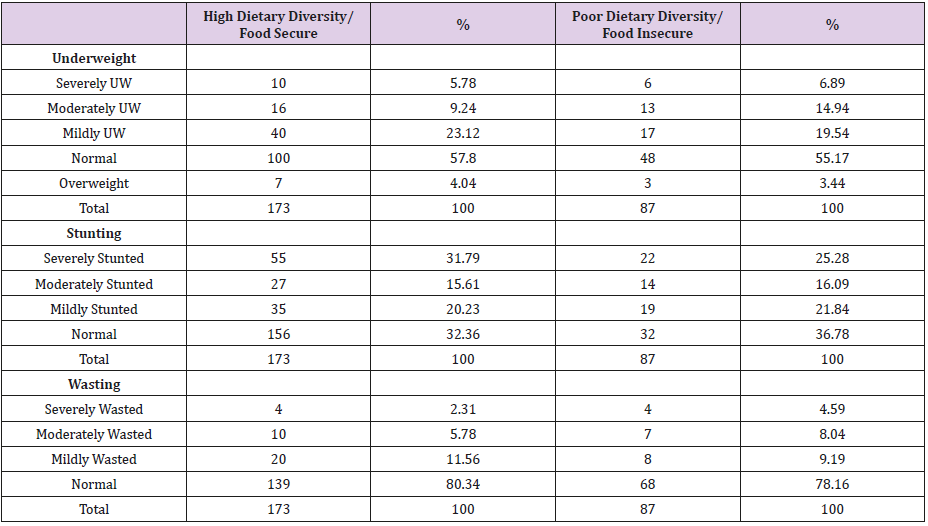
Table 7: Relationship between underweight (UW), Stunting and Wasting in children and Household Dietary Diversity Score (HDDS).
UW- underweight- x2 = 2.489, df = 6, p = 0.870
Stunting - x2 = 5.871, df = 6, p = 0.438
Wasting - x2 = 4.910, df = 8, p = 0.7675
About 6% each of households with little to no hunger had severely and moderately underweight children Table 8. It also shows that up to 10.44% of households with moderate hunger had moderately underweight children and 23.88% have mildly underweight children. Severe and moderate stunting was more prevalent in households with little to no hunger (32.32% and 16.16% respectively) than in households with severe hunger (28.72% and 11.7% respectively) [17]. Households with moderate hunger also have up to 26.86% of children who are severely stunted. Mild stunting was also more prevalent in households with severe hunger (23.40%) than in those are food secure (21.21%).
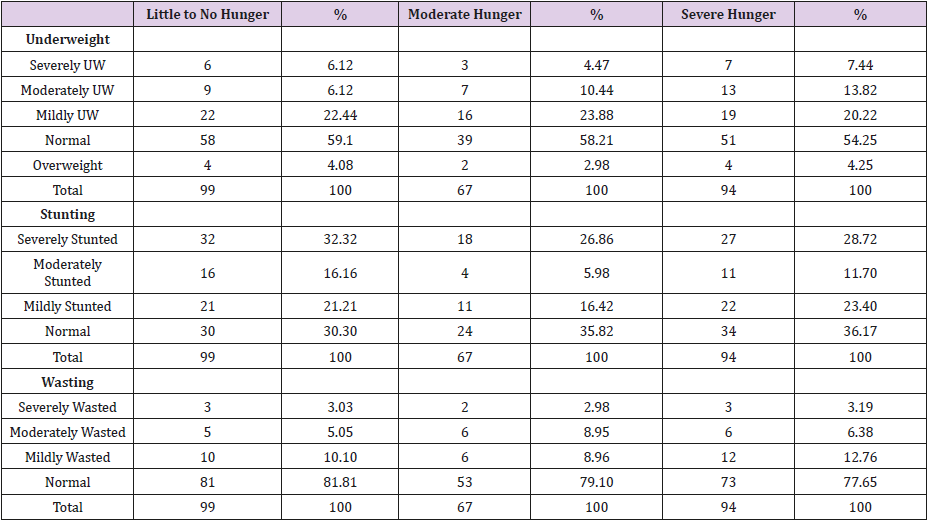
Table 8: Relationship between underweight (UW), Stunting and Wasting in children and Household Hunger Scale (HHS).
UW- underweight - x2 = 5.797, df = 12, p = 0.926
Stunting - x2 = 16.571, df = 12, p = 0.166
Wasting - x2 = 5.099, df = 16, p = 0.995
Discussion
The relationship between the food security measures and the nutritional status of the children in this study disproves the general conception that food security is nutrition security. Baker- French [18,19] drew similar inferences which showed that in the rural populations, there were 2.2 greater odds that a stunted child would be in a food secure home and in the urban population, there were 2.4 greater odds that a stunted child would be in a food insecure home compared to a food secure home. Mohiddin, Phelps and Walters [20] also found that both acute and chronic food insecurity and undernutrition is prevalent among urban and food secure populations, especially the urban poor. This further shows that factors such as ignorance on food selection, combination and choices can affect food security and nutritional status since even children in urban and food secure households present with stunting and other nutritional problems. It can also be inferred that nutrition security is not guaranteed by the increased income levels associated with urban areas. This is in conformity with the [21] figures which stated that children are undernourished in onefifth of the richest households as well. This however does not agree with the results of in a study carried out in Uganda which showed that out of the 95 households found to have wasted, underweight and stunted children, the majority (85.3%, 88.3% and 91%) were generally from food insecure households.
This disparity in nutritional status of food secure households shows that the major problem here cannot be attributed to food availability or accessibility but to food utilization; and encompasses factors including ignorance on food selection, combination and preparation, traditional beliefs, customs and practices, improper feeding practices during complementary feeding, underlying health problems/infections which decrease nutrient absorption by the body, inadequate care practices and unsanitary environment. The prevalence of childhood stunting especially which was higher in households that are food secure suggests that stunting in these areas may not be associated with inadequate food intake but may be a consequence of inappropriate diet and infections associated with poor breastfeeding, infant and young child feeding practices, contaminated water sources and/or inadequate sanitation. It is therefore likely that maternal knowledge and behaviour change regarding breastfeeding, infant and young child feeding practices and food handling would also need to be improved to have impact on stunting rates. While it is nevertheless possible, for children in severely food insecure households to have normal nutritional status, the food insecure situation of the household still poses a challenge and the nutrition security of the children is threatened.
There are limitations to this study and further research is needed to develop and test the hypotheses presented. This work did not research into the breastfeeding practices of women so as to expressly determine the causes of stunting in children in these areas. For the variables that were found to be associated with food insecurity such as occupational opportunities for women in rural areas, ignorance about feeding practices, seasonal variations etc., more work ideally in the form of focus groups, is needed to identify opportunities for effective interventions in these key areas. It would be appropriate to conduct more extensive investigation into women’s diets.
Conclusion
A clear evidence from this study revealed that households that are food secure by the criterion of HFIAS, HHS and HDDS had varying degree of malnutrition amongst the under-five children living in the household. It is saddened that a lot of projects have been based on improving food security with no priority intervention studies allocated for better nutritional status of the household members especially the vulnerable groups such as the under-five children, pregnant mothers, lactating mothers and the elderly.
References
- (2012) Food and Agriculture Organisation. The State of Food Insecurity in the World 2012. The Food and Agriculture Organization of the United Nations Rome.
- Smith LC, Ali S (2007) Measuring Food Security Using Household Expenditure Surveys. Food Security in Practice Technical Guide Series. 2007. International Food Policy Research Institute. Washington DC, pp. 147.
- (2014) Food and Agriculture Organisation. The State of Food Insecurity in the World 2014: Strengthening the enabling environment for food security and nutrition. Rome FAO.
- (2010) United Nations Children Fund. State of World’s Children Report.
- (2012) United Nations Children Fund. Demographic and health surveys in Nigeria.
- (2011) Food and Agriculture Organisation. Monitoring progress towards hunger reduction targets of the World Food Summit (WFS) and the Nigeria Millennium Development Goals (MDGs). 2011b Rome Italy- Global statistics service.
- (2012) Food and Agriculture Organisation. Food security information for action, Practical Guides. Rome: EC - FAO Food Security Programme.
- Abubakar MS (2013) An Empirical Analysis of Households Food Security in Gombe State, Nigeria; Undergraduate Project, Department of Economics, Faculty of Social Sciences, Ahmadu Bello University Zaria.
- (2006) Food and Agriculture Organisation. Food Security Agricultural and Development Economics Division, Food and Agriculture Organisation of the United Nations Rome.
- (2009) International Food Policy Research Institute. Ensuring Food Security and Nutrition Security in Nigeria: An Assessment of the Challenges, Information Needs and Analytical Capacity. Nigeria Strategy Support Program (NSSP). Background Paper NSSP 007.
- Ahungwa GT, Haruna U, Muktar BG (2014) Food Security Challenges in Nigeria: A Paradox of Rising Domestic Food Production and Food Import. Int Let Natural Sci 13(1): 38-46.
- Okezie JS (2009) Umuahia East Local Government History. Umuahia East Press Umuahia.
- Baker-French SR (2013) Food Security and Nutritional Status in Fishing Communities in Bolivia’s Northern Amazon: Results of a Household Survey. 2013 Accessed on November 17 2015.
- Ballard T, Coates J, Swindale A (2011) Household Hunger Scale: Indicator definition and measurement guide. 2011. Available at Accessed 18 November, 2015.
- (2000) National Health and Nutrition Examination Survey. 2000 CDC Growth Charts: United States Site internet. Hyattsville: Centers for Disease Control and Prevention.
- (1997) World Health Organisation. Physical Status: Use and Interpretation of Anthropometry- Report of a WHO Expert Committee. WHO Technical Report Series 854. World Health Organisation, Geneva,USA.
- (1966) World Health Organisation. WHO Working Group: Use and Interpretation of Anthropometric Indicators of Nutritional status. Bull World Health Organ 64(6): 929-941.
- Okeke EC, Onyechi UA, Ibeanu VN (2011) Practice of Nutrition: A Handbook. University of Nigeria Press Ltd Nsukka Enugu state Nigeria.
- Mohiddin L, Phelps L, Walters T (2012) Urban malnutrition: a review of food security and Nutrition among Urban poor London: Nutrition Works. Int Public Nut Res Grp p. 19-35.
- (2011) World Bank. Nigeria- Nutrition at a Glance. Nutrition at a Glance; Nigeria. Washington DC; World Bank.
- Lwanga F, Wanyenze R, Matovu (2015) Food security and Nutritional Status of Children Residing in Sugar-cane Growing communities of East- Central Uganda: A cross sectional study. J Food Sec 3(2): 34-39.
