 Research Article
Abstract
Animal and human mineral status and health have been estimated by soil analyses and amounts of fertilizer consumptions. Results are varied depending on species, gender, annual or seasonal period selected and quality of data.
This study is treating Finnish age-standardized death rates, aged 15-64 (1/100 000) “(15-64)”, from cardiovascular diseases (CVD) and other causes of death (Non-CVD) and their regressions by mineral fertilizer consumption parameters from 1970-2013. The data are from old sources. Fertilizer data are used as 3 year mean weighted means (3ymw). Because of the disadvantageous effects of high K/(Ca+Mg) fertilization ratio e.g. on magnesium availability and effects of high total fertilization level on availability of own mineral elements of soil, CVD, Non-CVD and its subgroups have been assessed by combined regression of K/(Ca+Mg), Factor.1, and the sum of fertilizers [CaMgNPK], Factor.2,: [K/(Ca+Mg);CaMgNPK].
Results: (Combined regression by) [K/(Ca+Mg);CaMgNPK] explained highly significantly (p < 0.001) mortality from CVD (91 %), Non-CVD (86 %), Respiratory diseases (81 %), Digestive diseases (81 %), Land traffic accidents (87 %), Suicides (62 %) and Assault (41 %). Regression coefficients of both factors were positive, when coefficient values could be determined significantly. By replacing K with P matches were generally better.
Conclusions: Combined regressions by fertilizer ratio K/(Ca+Mg) – as well as P/ (Ca+Mg) – with total fertilization explained significantly CVD and Non-CVD mortality variation during 1971-2012.
Keywords: Human; CVD; Non-CVD; Mortality; Fertilizers; Ca; Mg; N; P; K
Abbreviations: 3ymw – 3 years mean weighted mean (X.3ymw.i = ¼*[X.(i-1) + 2*X.i + X.(i+1)]; [CaMgNPK] – equivalent sum of Ca, Mg, N, P and K. Beta coefficient – in each single factor before regression all values are subtracted by their mean and divided by standard deviation, i.e. standardized to z-scale); Ca – calcium (or Ca.fm (Eq)); CO3.appr – Liming agents (kg) x 20.37 if Mg-% is 3; (CVD – (mortality from) cardiovascular diseases; Diabetes – (mortality from) Diabetes mellitus; Digest_D – (mortality from) Diseases of the digestive system excl. alcohol-related diseases; Eq – equivalents; FM – human (females + males); fm – mineral fertilization; K – potassium – (or K.fm (Eq)); Land traffic accidents – Land_traff._acc; Mg – magnesium (or Mg.fm (Eq)); N- nitrogen (or N.fm (Eq)); Non-CVD – difference between total mortality and CVD (i.e. it includes non-disease mortality, too); P – phosphor (or P.fm (Eq)); Resp_D – (mortality from) Diseases of the respiratory system; S – Sulfur; StFin – Statistics Finland.
Introduction
In epidemiological studies foodstuff composition tables can be misleading [1]. The relative plant contents of Ca, Mg, K and Na are depending on their relative contents in soil. [2]. N-fertilization can increase Mg-content of plants [3], but later N-fertilization can cause Mg-exhaustion in coarse mineral soils (even including silt) [3]. Liming also can reduce the Mg availability from soil own reserves (e.g. via leaching) [3]. Proper Mg status has effects on general and cardio-vascular health of humans and animals [4].
Increase in mineral (“commercial”)/recycled fertilizer ratio in plant nutrition has reduced the proportion of (weathered) mineral elements in plant nutrition affecting on plant silicon (Si) content [8 ->4]. Cardio-protective ability of Si is usually explained by its structural characteristics [28 -> 5], but other explanations are given [8.b ->6].
Grass K/(Ca+Mg) equivalent ratio over 2.2 can cause grass tetany in cattle [4 ->7]. Kemp found that cattle serum Mg associated positively with herbage Mg, negatively with herbage K and N (crude protein) [5-> 8]. So total impact of N is obscure. Haaranen wrote about clinical signs associated with Ca, Mg and P balance of plasma: “It is known that cows with declining plasma Ca and P are clinically somnolent and paretic (with flaccid paresis), especially when same time often Mg-values are elevated. If on the other hand Ca and Mg are declined and P elevated, the sign is tetany (spastic paresis) [Photo 1.]. When Ca is normal occurs often muscle weakness, if plasma P and Mg values are low, but head (brain) is alert.” [7-> 9]. This suggested to test factor [P/(Ca+Mg)].
This manuscript excluded CHD and non-CHD because non-CHD includes several vascular disease groups. The aim of this study is to clarify, whether variation in CVD, Non-CVD and some of its sub-groups could be explained by combined regressions with fertilizer ratios [K/(Ca+Mg)], as well as [P/(Ca+Mg)], and total fertilization in 1972 – 2012.
Materials and Methods
Mg mineral fertilization is the sum of Mg from liming agents and “fertilizers”: Annual Mg supplementation (here “mineral fertilization” – fm, independently on sources) rates from liming agents are estimated as in [10]: by roughly estimated Mg-%´s: for 1951-71 2%, for 1981-89 7 %, for 1990-99 6 % and 2000-06 5 %, (“in the 3rd millennium”) [11] for 1972-80 as earlier presented [10,3], for 2007-13 5 % (by continuation supposed by the author). Annual total amounts of liming agents are from [12], which is visually congruent with [13], for 1971-99 and from [15 -> 14] for 2000-13. The calculated Mg amounts were then divided by area of arable land [16 -> 15]. Mg from “fertilizers” (kg/ha) for 1971-80 are as such from Jokinen [3], for 1981-2013 by dividing total Mg from annual (non-liming agent) fertilizers [17 -> 16,18 -> 17,19 -> 18] with arable land area [16 - >15].
N, P and K (fm) rates for 1971-2000 are obtained from FAOSTAT [20 ->19] and for 2001-17 from [21 ->20] by dividing them by area of arable land [16 -> 15].
Results
Combined Regressions
Ca.fm is composed from several sources: Ca.fm estimates from liming agents are obtained by multiplying the (remain) CaCO3 proportion of liming agents (liming agents minus MgCO3 ) by Ca/ CaCO3 ratio (40.1/100.1). Ca from Ca-nitrates and Ca-ammoniumnitrates for 1971-2002 are obtained by multiplying their annual rates [20] by their Ca-proportion and dividing by arable land area [16-> 15]. Consumption of Ca-nitrates seems to have been ceased in 1993. Missing data on Ca(NH4 )(NO3 ) for 2003-2013 (3.6 kg/ha 3 % in 2002) [20-> 19,16 -> 15] are estimated by total N-fertilizer ratios [21 -> 20] of successive years (y) [Ca.N.y =N.y/N.(y-1)*Ca.N.(y-1) - beginning from 2003]. Ca.fm rates from phosphates are estimated by multiplying P fertilizer rates by 0.65 (Ca/superphosphate ratio). Because of high annual variation in consumption of fertilizers [4], they are smoothed to 3 year mean weighted means (3ymw). [X.3ymw.i = ¼*(X.(i-1) + 2*X.i + X.(i+1)].
“Deaths/age-standardized deaths rates by Gender, Underlying cause of death (54-group short list)” concerning “Age-standardised death rates, aged 15-64 (1/100 000)” are from Statistics Finland [22 -> 21]. Causes of death treated are CVD [27-30 Diseases of the circulatory system excl. alcohol-related (I00-I425, I427-I99)], Non-CVD – difference between [01-54] Total mortality and CVD, Diabetes [(23) Diabetes mellitus (E10-E14)], Respiratory Diseases [(31-35) Diseases of the respiratory system (J00-J64, J66-J99)], Digestive system diseases [(36) Diseases of the digestive system excl. alcohol-related diseases (36)], Land traffic accidents [42 Land traffic accidents], Suicides [(50) Suicides (X60-X84, Y870)] and Assault [51 Assault (X85-Y09, Y871].
Mortality associations were assessed by [K/(Ca+Mg);CaMgNPK], [P/(Ca+Mg);[CaMgNPK] and by regression in which (Ca+Mg) was replaced in both factors by CO3.appr (Eq) ( i.e. 20.4 x Liming agents (kg)), as if unchanged Mg-% in liming agents were 3: {[(K/ CO3.appr)/CO3.appr);Sum(CO3.appr,NPK)]}, Results are given as R squares and as standardized (Beta) coefficients (value of each coefficient is given as standard deviation units of its range). The range of [K/(Ca+Mg)] was 3.9, [P/(Ca+Mg)] 3.7 and [CaMgNPK] 3.6 SD units. So standardized coefficients in multiple regression reflect, which one of the two factors – Factor.1 (fertilization ratios) or Factor.2 (total fertilization) - “explained” better the regression. Ratios of the Beta coefficients of each regression is given (as absolute values in order to show their strength, without adjusting by their range specific weights).
Calculations have been made by IBM SPSS Statistics, Version 25 program.
Next are represented combined regressions of death rates of CVD, Non-CVD, Respiratory diseases, Digestive diseases, Land traffic accidents, Suicides and Assault by [K/(Ca+ Mg)] and [CaMgNPK] {[K/(Ca+ Mg);CaMgNPK]}, as well as by [P/(Ca+ Mg)] and [CaMgNPK] {[P/(Ca+ Mg);CaMgNPK]}. The R squares of (Table 1) differ from each other on an average by 1.8%-units. Their order was nearly the same, but Resp_D and Digest_D and on the other hand Suicides and Diabetes had changed the place. In Table 2 regression with Diabetes was slightly weaker. In both tables causes of death with highest R squares over 0.8 had C.1/C.2 ratio >1, by them the regression was mainly explained by fertilization ratio (Factor.1). By Suicides and Assault regressions were mainly explained by Factor.2 (total fertilization).
Discussion
Annual variation in CVD, Non-CVD and its sub-groups assessed by combined regressions by fertilizer ratios {[K/(Ca+Mg)] and [P/ (Ca+Mg)]} with [CaMgNPK] explained CVD by 91-93 % and NonCVD (total) by 86-87 %, i.e. lesser by 5-6 %. Independently on small number of cases in some Non-CVD subgroups, all represented regressions were highly significant (p < 0.001). The effects are suggested to be based mainly on availability of Mg, silicon (Si) and P.
After 1971 Non-CVD (total) stopped to decline in 1983-84 and it exceeded the level of 1984 until 1994 same time when CVD seemed to decline about following its exponential trend-line (Fig. 1). Anyhow closer analysis reveals similar simultaneous (although lesser) changes in CVD as in Non-CVD: stagnation in 1983-85 and slight deviation upwards from exponential line between 1983 and 1993, i.e. reduction of CVD did not occur obviously by cost of NonCVD. Even Beta coefficient ratios (C.1/C.2) of CVD and Non-CVD (total) were similar in (Table 2 and 3). The result is surprising, because K/Mg [10] and P/Mg [22] have been associated stronger with Non-CHD than CHD. The closer analysis of [22 -> 21 and Table 1] revealed that fertilization ratio [K/Mg] even during this period explained better Non-CHD (and Non-CVD) than CHD (and respectively CVD) in concordance with [10] (there was variation inside CVD, too). Both high K-fertilization ratios [K/Mg and K/ (Ca+Mg)] associate with low plant Mg-proportion. In human nutrition Mg deficiency seems to have been more important than K excess. (Ratio K/Mg was discarded from general survey because of difficulties in proper Mg.fm determination in Finland and other countries).
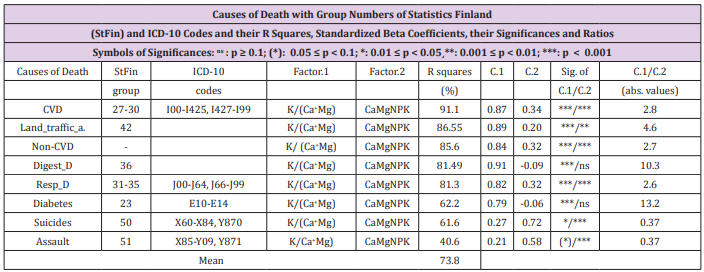
Table 1: Combined Regressions by [K/(Ca+Mg); CaMgNPK]. Causes of death with group numbers of Statistics Finland.
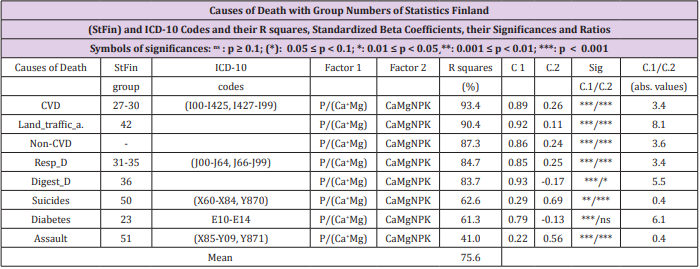
Table 2: Regression by [K/(Ca+Mg);CaMgNPK] explained highly significantly (p< 0.001) CVD (91%), Land traffic accidents (87 %), Non-CVD (86 %), Digestive diseases (excluded alcohol related diseases) (81 %), Diseases of the respiratory system (81 %), Diabetes (62 %), Suicides (62 %) and Assault (41 %).
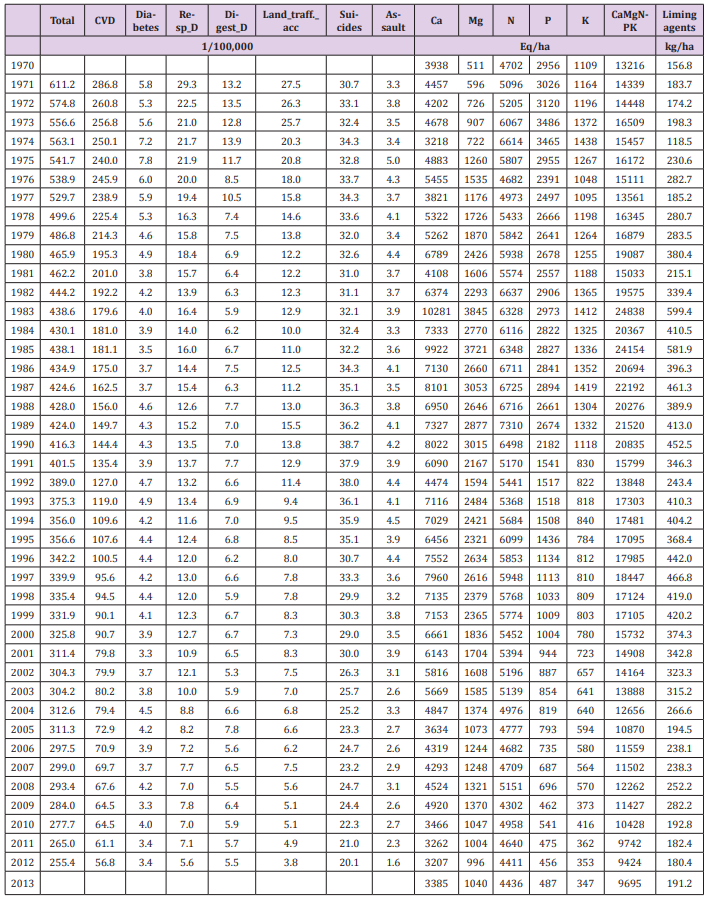
Table 3: Regression by [P/(Ca+Mg);CaMgNPK] explained highly significantly (p< 0.001) CVD (93 %), Land traffic accidents (90 %), Non-CVD (87 %), Diseases of the respiratory system (85 %), Diseases of the digestive system (84 %), Suicides (63 %), Diabetes (61 %) and Assault (41%).
R squares of Tabl. 3 are on an average 1.8 %-units higher than the respective values in Tabl. 2. Only regression with Diabetes was slightly weaker in In Tabl. 3. Factor 1 was generally stronger than Factor.2 (C.1/C.2 > 1), but by Suicides and Assault regressions were mainly explained by Factor.2 (total fertilization).
Independently on similar slope in Fig. 1, CVD declined at double speed to Non-CVD (look scales on the left and right side!). This suggests on higher sensitivity of CVD to Non-CVD on (biological and social) environmental changes. Different reduction speed makes the Non-CVD regressions seemingly broader to CVD regressions. Additionally to slope, differences in Beta coefficient proportions reflect differences between Non-CVD subgroups. Syndromes of central nervous system (Suicides and Assaults) associated stronger with [CaMgNPK] — suggesting on silicon effect. Obviously the rapid responses in Respiratory diseases (Tabl.5) and Land traffic accidents (Tabl. 8) could be explained by their dynamic character and the slower reactions (if any) in Diabetes (Tabl.7) by its chronic character.
Sum of fertilizers are calculated by equivalents. Fertilizers can be cations or anions. N includes somewhat Ca and P includes Ca, too. N exists in cations and anions. So the “sum of fertilizers” is higher than the equivalent sum of cations and smaller than the sum of cations and anions. It is missing chlorides, carbonates and sulfates. Because Mg % in liming agents is only roughly approximated, surrogates have been calculated by replacing (Ca+Mg) by approximate CO3 equivalents (CO3 .appr = 20.4 x Liming agents (kg)) in both factors: [(K/CO3.appr)/CO3 .appr);Sum(CO3 . appr,NPK)] and results have been similar (e.g. in Fig. 4). Ranges of CO3 converter coefficient between liming agents containing 2%-7 % Mg are from 20.2 to 20.9. So CO3 .appr does not need precise Mg determination for Factor.1 and Factor.2 approximation in countries where (Ca+Mg) is mainly composed of liming agents. Effects of soil-types and fertilizer accumulations — even important — are excluded from this survey.
Remarkable was the high correlation between amounts of K and P fertilizers (+0.97) and between Ca and Mg fertilizers (+0.96). These can cause difficulties in estimating effects of single ions.

Figure 1: Represents Finnish CVD and Non-CVD mortality relative to their values in 1984. The figure shows that Non-CVD exceeded its 1984 level between 1984 and 1994. and CVD deviated between 1983 and 1993 upwards from its exponential trendline. CVD shows even a slight stagnation in 1983-85. Because of the fluctuation and change in decrease of Non-CVD in 1983 its beginning label could be given for year 1983 as well as for 1984.
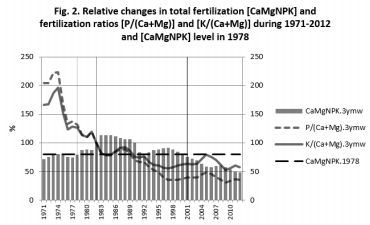
Figure 2: Represents relative changes in total fertilization [CaMgNPK] and in fertilization ratios of [P/(Ca+Mg)] and [K/ (Ca+Mg)] in 1971-2012. [P/(Ca+Mg)], [K/(Ca+Mg)] and [CaMgNPK] are the regression factors in the next survey.
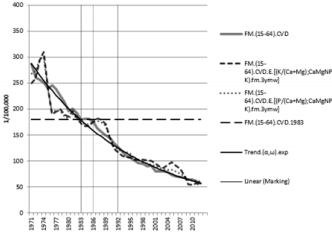
Figure 3: Represents CVD mortality and its combined regression of CVD by [K/(Ca+Mg); CaMgNPK] and by [P/(Ca+Mg); CaMgNPK]. [K_(Ca+Mg); CaMgNPK] explained CVD by 91.1% and [P_(Ca+Mg); CaMgNPK] by 93.4%. Both regressions were highly significant (p < 0.001).
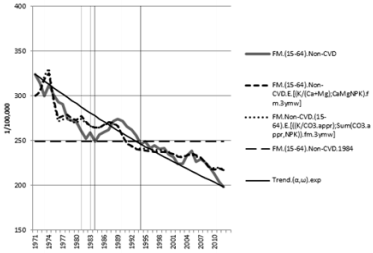
Figure 4: Represents Non-CVD mortality and its combined regression by [K/(Ca+Mg);CaMgNPK] and by [(K/CO3.appr)/ CO3.appr);Sum(CO3.appr,NPK)], in which (Ca+Mg) was replaced by approximate CO3. [K/(Ca+Mg);CaMgNPK] explained Non-CVD by 85.6 % and [(K/CO3.appr)/CO3.appr);Sum(CO3.appr,NPK)], by 84.9 %. Both regressions were highly significant (p < 0.001).
There are differences between databases concerning area of cropland [16 -> 15,24->23]. Because the access of FAOSTAT data [16 -> 15] was easier they were benefited. This can affect the annual fertilizer rates (kg or Eq/ha). There are even differences in tabulation of data, which are harmonized by time [25-> 24]. Utilization of 3ymw values smoothed the great variation in liming agent consumption in successive years. Maximum inter-annual ratio before smoothing in liming agents was 78 %. 3ymw values smoothed even the differences between fertilizer data in [15-> 14] and [20 -> 19]. Annual consumption of fertilizers was determined by dividing the total amounts by arable land area [16 -> 15], with one exception: for 1971-80 Mg from “fertilizers” is from [3]. Remarkable change in fertilizer composition was the supplementation by selenium (Se), since autumn 1984 [25]. So 1986 was the first whole year when domestic food was Se-rich, which possibly associated with rapid decline of CVD in 1986, although regressions in Fig. 3 suggested on longer duration of CVD stagnation. Se did not have remarkable effects on Non-CVD. Se effects became contaminated by the sum of fertilization [CaMgNPK], which obviously reduced Si availability and increased need of Se [4,6]. That´s why predicting effects of other fertilizers (e.g. nitrogen) in the last half of the 1980´s became difficult. In order that the Fig. 1 and 3 could show CVD change in 1986, mortality values are not smoothed although 3 ymw smoothing determines start of Non-CVD period to 1983 (the start of CVD stagnation).
Veterinary surgeon Haaranen reported on a new bovine paresis epidemic in 1976-77: Earlier cool, somnolent and flaccid paresis was associated with low Ca and P and elevated Mg, but in 1976- 77 cows were hot, irritable, tense and spastic [26] with low serum Mg (0.58 mmol/L, ref [27]: 0.82 -1.43 mmol/l) and glucose (1.5 mmol/L, ref. [27]: 2.8 – 4.1 mmol/L (mol. weight of glucose 180.2 g) additionally to low Ca (1.42, ref [27]: 2.17 – 2.74] and P 1.13, ref [27]: 1.45 – 2.58 mmol/L) . He reported [26] that fodder Mg content had decreased between 1959 and 1976-77 from 0.25 to 0.11 % (%/ dry weight), raw protein (rp) (nitrogen) increased from 10 to 18 % and K content from 1.5 to 3.5 %. So about similarly with Kemp [8], he calculated and found that fodder (rp x K)/Mg ratio (risk indicator of hypomagnesaemic tetany) had increased since 1959 from 60 to 525. I.e. not only fertilization, but food and fodder were changed. Haaranen [26] reported on increased number of ketoses during the same season and on increased cases with fat deposition of liver. Because mineral imbalances could have caused metabolic and psychic disturbances in cows, the same mineral imbalances could have had metabolic and somato-psychic consequences in humans.
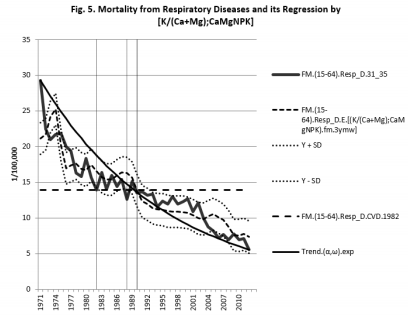
Figure 5: Represents Mortality from respiratory diseases (Resp_D) and its regression by [K/(Ca+Mg);CaMgNPK], which explained it by 81.3 %. Resp_D stayed above 1982 level until 1988 (and visited in 1990). Resp_D has ended and seems to have started earlier than Non-CHD (total).
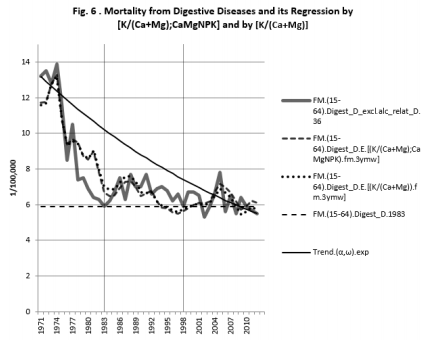
Figure 6: shows mortality from Digestive diseases (Digest_D) and its regression by [K/(Ca+Mg);CaMgNPK] and by [K/ (Ca+Mg)]. [K/(Ca+Mg);CaMgNPK] explained it by 81.5 % and [K/(Ca+Mg)] by 80.7 %. Digest_D exceeded the level of 1983 until 1998. After that it kept about the same level. Because of the fluctuation of the mortality curves Digest_D “epidemic” seems to have started same time with Non-CVD (total), but was continuing longer.
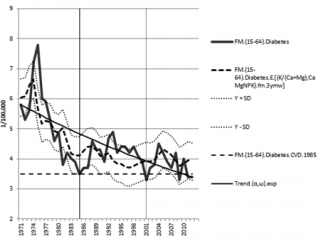
Figure 7: Shows mortality from Diabetes and its regression by [K/(Ca+Mg);CaMgNPK] which explained it by 62%. It started one year later and ceased, i.e. went below the start level, 7 years later than Non-CVD (total).
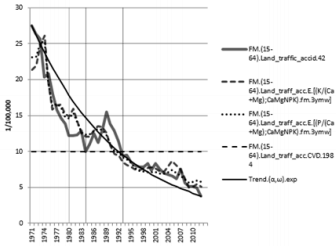
Figure 8: Shows mortality from Land traffic accidents and its regression by [K/(Ca+Mg);CaMgNPK] and [P/ (Ca+Mg);CaMgNPK]. [K/(Ca+Mg);CaMgNPK] explained this accident mortality by 86.5% and [P/(Ca+Mg);CaMgNPK] by 90.4 %. This “epidemic” started in 1984 and ceased in 1993. There is an abrupt change in reduction as early as 1980, possible to define it as a start and an early signal of this “epidemic”.
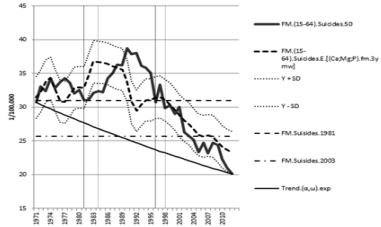
Figure 9: Represents mortality from Suicides and its regression by [K/(Ca+Mg);CaMgNPK], which explained it by 61.6 %. It exceeded the level of 1981 until 1996 and declined below it (continuously) since 1998. It begun 3 years earlier than Non-CVD (total) and ceased 2 years later.
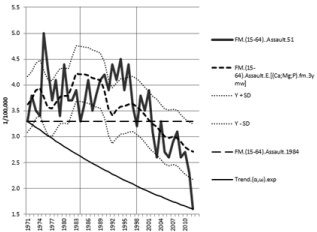
Figure 10: represents Assault mortality and its regression by [K/(Ca+Mg);CaMgNPK], which explained it by 40.6% (p < 0.001). In the regression curve is seen the profile of the stronger factor, total fertilization [CaMgNPK], as by Suicides (Figure 8). The small number of cases is associated with great fluctuation. The top of its regression (1977-92) is poorly matching with it (during high Mg supplementation and changes in alcohol consumpti.
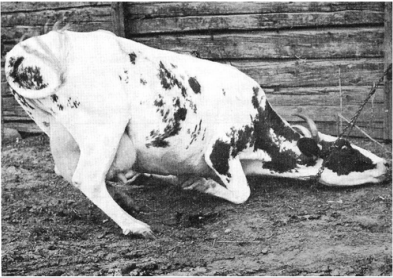
Figure 11: Acute Mg deficiency in a cow. Beginning spastic paresis. N.B. fearful look, rapidly beating tail and deficiency in control of movements.” (Permission by Haaranen S). Haaranen S. Observations on magnesium in cattle feeding [In Finnish “Havaintoja magnesiumista nautakarjan ruokinnassa”]. Special print of Bulletin of Sementtiyhdistys [Sementtiyhdistyksen Tiedotuksia -lehden erikoisnumero]. pp. 15-20, 1970
It was expected that in 1976-77 S-P would have been elevated, not low, because P/(Ca+Mg) ratio in fertilizers was at its highest during the first half of the 1970’s [as K/(Ca+Mg)] and declined ca 80 -70 % until the beginning of the 1990´s. But these ratios were declining since 1974 (Tabl. 1). Explanation can be included in the total fertilization [CaMgNPK], which reached its maximum in 1985, increased 80 % between 1970 and 1985. One explanation could give the acid rains caused by SO2 emission, highest in 1970-82 [29], by changing N-P-S balance. Possibly vigorous tetany attacks could have changed serum composition (hyperkalemia?, organic anions?). Interesting is the low glucose value, why tetany attacks resembled insulin shock. Bovine S-Mg reference values, 0.82 – 1.43 mmol/L, (cf by humans 0.71-0.94, [30]) explain the difference between “normal” bovine and human psyche. So in the dualism of Mg effects: in Mg-excess Mg-narcosis (which is ceased in a few seconds by Ca-injection), on the other side in serious Mg-deficiency delirium tremens type condition (cardiac arrhythmia, irritability, spasticity) [31] cf [26] (Photo 1.). This dualism seems possible to be amplified by phosphorus: excess as a stimulant and deficiency seemed to work as a soporific [26]. Co-worker of nobelist AI Virtanen, Karström wrote that diet rich in phosphorus can increase aggressiveness [32].
This article is mainly a statistical presentation on mortality from CVD, Non-CVD and its subtypes and their associations with fertilization. Its biochemical importance is better to evaluate when respective data has been analyzed in other countries e.g. by replacing equivalent regression [K/(Ca+Mg);CaMgNPK], with {[(K/ (Liming agents (kg) x 20.4));Sum((Liming agents (kg) x 20.4),NPK)] and the same by replacing of K with P}
Conclusion
Combined regressions by fertilizer ratio K/(Ca+Mg) – as well as P/(Ca+Mg) – with total fertilization explained significantly CVD and Non-CVD mortality variation during 1971-2012.
Acknowledgement
I am very grateful to Professor Osmo Hänninen and late veterinary surgeon Seppo Haaranen for several (possibly hundreds) of discussions on these kinds of questions.
References
- Koivistoinen P, Ahlström A, Nissinen H, Pekkarinen M, Roine P (1970) Mineral Element Compositions of Finnish Diets Part I: Fe, Cu, Mn, Zn, Mg, Na, K, Ca and P. Suomen Kemistilehti B43 pp. 426-430.
- Itallie TB Van (1938) Cation equilibria in plants in relation to the soil. Soil Sci 46(3): 175-186.
- Jokinen R (1981) Requirements for Magnesium fertilization in Finland. J Sci Agricultural Society in Finland 53(4): 239-268.
- Kemp A, T Hart ML (1957) Grass tetany in grazing milking cows. Netherlands J Agr Sci 5: 4-17.
- Kemp A (1960) Hypomagnesaemia in milking cows: The response of serum magnesium to alterations in herbage composition resulting from potash and nitrogen dressings on pasture. Neth J Agr Sci 8: 281-304.
- Virtanen E (1973) Magnesium lypsylehmien ruokinnassa. Karjatalous 6(7): 16-18.
- Haaranen S (1968) Observations on hypomagnesemia with spasmodic symptoms on cows. [in Finnish with English Summary. ”Havaintoja lehmien kouristusoirein esiintyvästä hypomagnesemiasta”]. Suomen Eläinlääkärilehti (Finnish Veterinary Journal): 212-223.
- Toysa T, Hanninen O (2016) Compliance of Finnish Male CHD and Total Mortality with Soil Fertilization in 1957-1990. J J Agriculture 2(1): 013.
- Töysä T, Hänninen H (2017) Mg/Ca ratio in fertilization and agricultural soils, Mg percent of liming agents and human mortality in Finland during 1961-90. J Afr Ass Physiol Sci 5 (1): 29-40.
- Toysa T (2018) Associations of K/Mg fertilization ratio with non-CHD mortality in Finland during 1952-99.
- Töysä T (2018) Replacing Potassium by Phosphorus in Finnish CHD and Non-CHD Mortality Regressions by Fertilization Rates in 1961-2000 increased the Strength of Associations.
- Lauronen M (2007) Nordkalk Oyj Abp, Estimation of Mg% in carbonate liming agents: personal communications.
- Lauronen M (2007) Nordkalk Oyj Abp, Annual Finnish carbonate liming agent consumption (tn) in 1923-1999 (Exel via email).
- Yli-Savola, Sari. Kalkitusyhdistyksen Kalkitusopas. 4. uud. p. [Helsinki]: Kalkitusyhdistys.
- Hakemaasi sivua ei löydy
- Food and Agricultural organization of the United Nations.
- (1991) Statistical Yearbook of Finland p. 114.
- (2003) Statistical Yearbook of Finland p 164.
- (2014) Statistical Yearbook of Finland p. 166.
- Food and Agricultural organization of the United Nations.
- Food and Agricultural organization of the United Nations.
- Statistics Finland’s PX-Web databases.
- Varo P, Alfthan G, Ekholm P, Aro A, Koivistoinen P (1988) Selenium intake and serum selenium in Finland: effects of soil fertilization with selenium. Am J Clin Nutr 48(2): 324-329.
- Hakemaasi sivua ei löydy.
- Montero Serrano J. statistician FAOSTAT (personal communication).
- Haaranen S (1977) Havaintoja lehmien halvaus- ja ketoosisairauksista kuluvana sisäruokintakautena. Karjatalous.
- (2013) A “metabolic profile” is a series of specific analytical tests run in combination and used as a herd-based, rather than individual-based, diagnostic aid. Metabolic Profiling.
- Töysä T (2018) Regional associations of CHD and musculoskeletal morbidity with environmental and geographic factors-e.g. Ca, Mg, Si, Sn.
- Backman B (2004) Groundwater quality, acidification, and recovery trends between 1969 and 2002 in South Finland. Geological Survey of Finland. Bulletin pp. 110.
- Tervetuloa HUSLABiin.
- White A, Handler P, Smith EL (1968) Priciples of Biochemistry. pp. 1014- 1015.
- Karström H (1978) Oikea ravinto - terveytemme perusta. Kirjatoimi offset. Tampere pp. 204-206.
