 Research Article
Abstract
This study attempted to assess the potential risk of heavy metal exposure from the daily consumption of herbal and true tea due to their toxic effects which could result in serious carcinogenic side effects and its environmental impact via Estimated Provisional Weekly Intake (EPTWI) results and comparing it to the Accepted Provisional Weekly Intake (APTWI) set by the Food and Agricultural Organization/World Health Organization Joint Expert Committee on Food Additives (JECFA). Focus was given to the following elements: Lead (Pb), Cadmium (Cd) and Chromium (Cr), as well as nontoxic elements including; Iron (Fe), Manganese (Mn), Nickel (Ni), Zinc (Zn), Copper (Cu), Cobalt (Co) and Tin (Sn), which were analyzed using Inductively Coupled Plasma/Optical Emission Spectrophotometer (ICP-OES) after sample preparation (digestion) using high performance microwave. The results showed Mn and Cd were the highest (991.8 ± 66.2 μg/g) and the lowest (0.09 ± 0.03 μg/g) in both herbal and true tea samples, respectively. At maximum concentration the estimated exposure ranged from 0.0007 μg/g/bw/week of the EPTWI for (Ni) element to 0.0026 μg/g/bw/week of the EPTWI for (Mn) element. These results were found to be not significant in terms of potential consumption risks of all tested brands, when compared to the APTWI.
Keywords: Heavy Metals; Herbal Tea; True Tea; Toxicity; Icp-Oes; Infusion; Microwave Digestion
Introduction
Tea (Camellia sinensis L.), is one of the most popular nonalcoholic beverages, consumed by over two-thirds of the world’s population for its medicinal, refreshment and mild stimulant effects [1]. Tea leaves contain polyphenols such as epigallocatechin 3‐gallate, which has many medicinal properties, including antioxidant, cholesterol-lowering, hepatoprotective and anticancer activities. Moreover, its detoxifying properties are essential in the elimination of toxins [2]. However, considering that an estimated 18 billion cups of tea are consumed daily worldwide, its economic and social importance is unprecedented. In fact, tea has been reported to be valuable in the treatment and prevention of multiple diseases [3]. Ideally, tea should be free from contaminants such as heavy metals, which are toxic and harmful to the human body because of their non-biodegradable nature, long biological half-lives and persistent accumulation in different body parts. Tea is classified into three main categories, according to degree of fermentation: unfermented green tea, partially fermented oolong and paochong tea and fully fermented black tea [4].
Drying and roasting steps for the leaves are carried out after the fermentation process. Tea could be prone to heavy metal contamination during the growth period, manufacturing process or both. Subsequently, this contamination can pose as a potential threat to human lives, due to the tragic complications that occur with heavy metals amassing in the body [5]. For this reason, tea, has piqued a great interest and was chosen for this research. Agricultural soil contamination can be described as the corruption of soil, which affects its characteristics as well as its physical, chemical and biological properties negatively. This damage can influence all the living organisms whether directly or indirectly [6]. The frequent use of fertilizers and pesticides in Egypt has led to the accumulation of heavy metals, resulting in soil contamination [7]. Some of these metals include Lead (Pb), Cadmium (Cd) and Chromium (Cr) are not degradable, so they tend to transfer from the soil to plants [8].
Especially in industrial zones, which possesses higher levels of heavy metal accumulation in its agricultural lands, when compared to other zones. Therefore, this transfer of heavy metals is one of the key pathways for human exposure, via the food chain, when considering air and water [9]. ‘Heavy metals’ is a term that applies to a group of metals with similar chemical properties. Some of them exist naturally, while others have emerged from pollution [10]. Essential metals including Copper (Cu), Iron (Fe) and Zinc (Zn) play an important role in the body to maintain normal functions, when present at trace elements [11,12]. Other heavy metals possess high risk to human health such as Pb, Cd and Cr, these metals are on the list of the most dangerous metals that cause chronic diseases and have carcinogenic complications as well [13,14]. In this study, toxic heavy metals including Pb, Cd and Cr next to non-toxic metals including Mn, Ni, Zn, Cu, Co, Sn and Fe were mainly chosen for dietary exposure assessment, in diverse brands of black, green and herbal tea samples collected from Egyptian markets with different production dates, to evaluate their possible toxicity.
The determination of the presence of multiple elements in the samples was then performed using Inductively Coupled Plasma/ Optical Emission Spectrophotometer (ICP-OES). The obtained results were then compared to the Acceptable Provisional Tolerable Weekly Intake (APTWI) set by Food and Agriculture Organization/ World Health Organization Joint Expert Committee on Food Additives (JECFA) [15] to ensure the safety of these tea samples. Despite several studies done by [16,17], recommend routine checks, and several analyses are always in a requirement, with the intention of avoiding the risks associated with exceeding the intake beyond the tolerance limit standards, and to ensure as well as safeguard their quality and availability.
Methods and Materials
Sample Collection
The total number of tested samples is 35 of commonly consumed ones in Egypt (Cairo) which represents four marked brands of black tea, three brands of green tea, and two brands of herbal tea. The samples were collected from local markets with different production dates.
Apparatus
A PerkinElmer Optima 8300 inductively coupled plasma optical emission spectrometer equipped with ultrasonic nebulizer U5000 AT+ (CETAC), auto sampler S10, whisper cool (Poly science) and air compressor was used for determination of elements. Plasma flow (12 L/min), auxiliary flow (0.2 L/min), nebulizer flow (0.35 L/min), pump flow rate (2.5 L/min), RF power (1400 Watt), view distance ( 15 cm), axial plasma view and the basic wavelengths were (205.56, 230.786, 238.204, 227.02, 202.548, 189.927, 257.61, 327.393, 214.44, 206.836 and 220.353 nm) for Cr, Co, Fe, Ni, Zn, Sn, Mn, Cu, Cd, and Pb, respectively. Milestone high pressure microwave (Model: Ethos Up) was used for samples digestion. Water Purification System (Millipore – Q ® integral 5 (A10 ®) / Model ZRXQ005T0). Top bench balance Mettler Toledo has range from 0.1 mg to 210 gm. Electric heater was used in Sample infusion.
Reagents
Reference standard solutions were prepared from metal stock standards from Merck (1000 mg/l) and were diluted to the corresponding metal solution. Intermediate standard solutions, spiking mixture standard solutions and calibration standard solutions were prepared by diluting up to 100 ml with 2% of HNO3 for obtaining different concentrations.
Sample Preparation
The following two methods were adopted for this study and were commonly used for preparation of Black, Green and herbal tea samples
Sample Digestion: Based on the method described by [18], 1 g of each black, green and herbal tea samples was weighed into the microwave digestion vessel. 4-5 drops of de-ionized water and 8 ml nitric acid (69 %) were added to the digestion vessel and then 2 ml of hydrogen peroxide was added (30 %). The vessel was carefully placed in the microwave oven. A thermocouple probe was inserted in the reference vessel to start the cycle. Then, vessels were cooled in a water bath for about 30 minutes. 0.2 ml of Lu was added from Intermediate standard solution (100 mg/L) and volume was completed up to 50 ml using de-ionized water. The microwave oven program was adjusted as in the following Table 1.

Table 1: Microwave oven program.
Sample Infusion: Based on the method described by [19], all tea infusion samples were prepared by traditional methods of drinking tea. 2.5 g of each sample was added to 100 ml of boiling de-ionized water prepared on an electric heater. The mixture was left to cool at room temperature for 10 minutes and then filtered to obtain the clear solution for further analysis by ICP-OES.
Analysis and Determination: Manganese test of (1 mg/L) was used for axial viewing is useful to make sure all connection, nebulization and sensitivity are in good condition and internal standards were performed. After performing the Mercury realignment and preference manganese test, all the standard solutions of (1000 mg/L) for tested elements were diluted carefully, to the required concentrations with UHQ (Ultra High Quality) water for preparation of intermediate solutions of different concentrations. The technique is based on solid samples, where the digested solution was diluted with de-ionized water, then, the resulting solution was nebulized into core of coupled argon plasma, where temperature was about 10,000 K. The solution is then vaporized; the analytic species are automated, ionized and thermally excited and were detected and quantitated with OESC (Optical Emission Spectrometer). Measurements are then converted to elemental concentrations by comparing it with calibration standards.
Statistical Analysis
The results were expressed in mean±SD (Standard deviation). Data analysis of the obtained results was performed using Microsoft Excel.
Results and Discussion
Linearity and Calibration Curves
The linearity of calibration curves was evaluated based on the correlation coefficient. The ranges of the calibration curves for Cr, Co, Fe, Ni, Zn, Cu, Mn and Sn were determined by injection of (0.05, 0.1, 0.5, 1, 2, 3, 4, 5 and 6 mg/l) concentration levels, while linear calibration curves for Pb and Cd were determined by injection of (1, 3, 5, 10, 20, 40, 80 and 100 μg/l) concentration levels used for quantitative analysis. Table 2 represents the correlation coefficients of linear calibration curves that were automatically generated using software of Winlab32 version 5.4. Correlation coefficient of standard curves shows the accuracy of these calibration curves for the determination of heavy metal concentrations. The correlation coefficient values clearly demonstrate the reliability of using those calibration curves. Therefore, linear calibration curves were selected for quantifying the following elements Pb, Cd, Cu, Zn, Fe, Mn, Cr, Co, Sn and Ni in black, green and herbal tea samples.
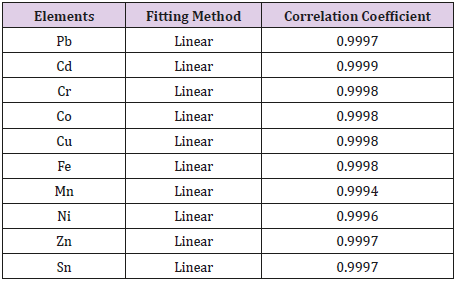
Table 2: Correlation coefficients of the calibration standard curves.
Heavy Metal Profile in Black, Green and Herbal Tea Digested Samples and Their Infusions
After running the samples, the results of total concentrations of studied heavy metals in black tea samples and their infusions Table 3, demonstrates ability of these plants to accumulate heavy metals, especially Mn (809.0 ± 288.3 μg/g) and Fe (213.3 ± 47.1 μg/g) at the higher concentrations, and the Zn (26.7 ± 3.5 μg/g) and Cu (17.3 ± 1.7 μg/g). Accordingly, our results disagreed with [20] as Fe is the first highest element in black tea samples not the second highest element. Different infused black tea samples results of different production dates, display the concentrations of Mn, Fe and Zn varied (141.0 57.36 μg/100 ml), (2.36 ± 0.71 μg/100 ml) and (5.51 ± 1.4 μg/100 ml), respectively. The results of total concentrations of the studied heavy metals in green tea samples and their infusions Table 4, shows the highest levels of heavy metals, especially Mn (991.8 ± 66.2 μg/g) and Fe (218.5 ± 100.1 μg/g), followed by Zn (31.86 ± 6.72 μg/g) and Cu (18.5 ± 4.52 μg/g). Consistent with infused samples results, the concentrations of Mn, Fe and Zn were wide-ranging (140 ± 28.1 μg/ 100 ml) , (3.57 ± 1.65 μg/100 ml) and (5.63 ± 1.17 μg/100 ml) in different green tea infusion samples of different production dates.
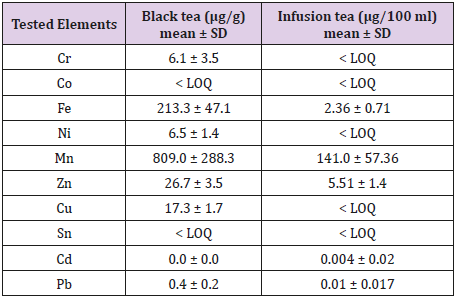
Table 3: Heavy metals concentrations in black tea samples and their infusions.
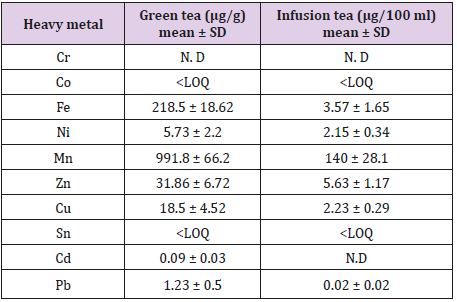
Table 4: Heavy metals concentrations in green tea samples and their infusions.
The results of total concentrations of studied heavy metals in herbal tea samples and their infusions Table 5, show the highest levels of heavy metals, especially Fe (373.5 ± 198 μg/g) and Mn (52.3 ± 2.03 μg/g), to a lesser extent Zn (24.7 ± 9.4 μg/g) and Cu (15.6 ± 1.63 μg/g). According to results of herbal tea infused samples, the concentrations of Mn, Fe and Zn varied (6.7 ± 0.73 μg/100 ml), (2.14 ± 0.16 μg/100 ml) and (3.24 ± 0.7 μg/100 ml) for Zn in different herbal tea infusion samples of different production dates. Our results were in agreement with [21], in which Mn was found to be in the range of (121.0 ± 0.4 μg/100 ml) to (657.0 ± 0.7 μg/100 ml) in 18 herbal types of infused tea samples. On the other hand, the concentrations of Co and Sn were less than Limit of Quantitation (LOQ) in all digested and infused samples, while Cr concentration was too low to be detected in both digested and infused samples. Cd and Pb were also too low in comparison to other elements. Our results were also in agreement with [2] that the lead, Cadmium and Chromium concentrations in tea samples were below maximum values set by the guidelines.
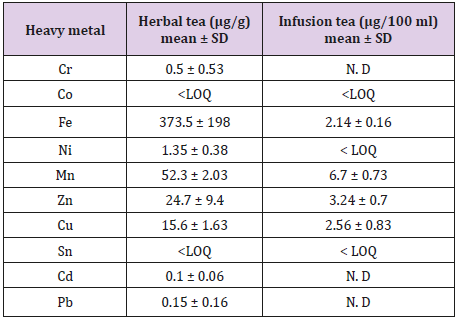
Table 5: Heavy metals concentrations in herbal tea samples and their infusions.
Mean Concentrations of Heavy Metals in different Brands of Tea Samples and their Infusions
Regarding the obtained results in Figure 1, the results were calculated in mean and SD (Standard deviation). The results show that the concentrations of heavy metals varied widely among tested brands of black tea digested samples and their infusions as well. Brand (1) in black tea show the highest concentration of studied heavy metal Mn, Fe and Zn (1128.5 ±77.9 μg/g - 269.0 ± 14.1 μg/g - 29.6 ± 2.0 μg/g) and (206.1 ± 8.1 μg/100 ml - 3.0 ± 1.16 μg/100 ml - 6.2 ± 1.0 μg/100 ml) in both digested and infused samples, respectively. The results in Figure 2, illustrate that the concentrations of heavy metals in brand (2) in green tea show the highest concentration of studied heavy metal including Fe, Zn and Cu (333.67 ± 21.47 μg/g - 33.8 ± 5.85 μg/g - 21.0 ± 5.66 μg/g) and (5.26 ± 1.21 μg/100 ml - 6.0 ± 0.43 μg/100 ml - 2.53 ± 0.17 μg/100 ml) in both digested and infused samples, respectively. Brand (1) show the highest concentrations of studied heavy metals including Mn (1027.8 ± 85.16 μg/g) and (124.3 ± 13.2 μg/100 ml) in both digested and infused samples, respectively.
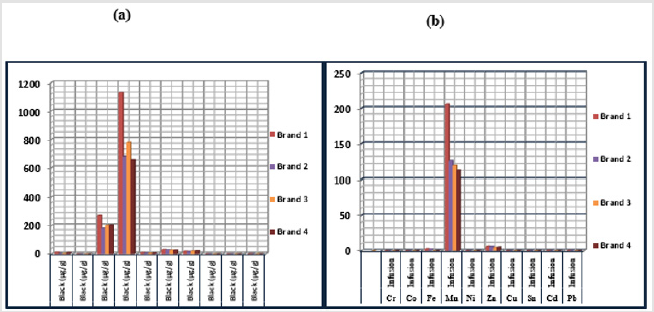
Figure 1: Mean concentrations of heavy metals in: (a) black tea samples in (μg/g). (b) Black tea infusions in (μg/100ml).
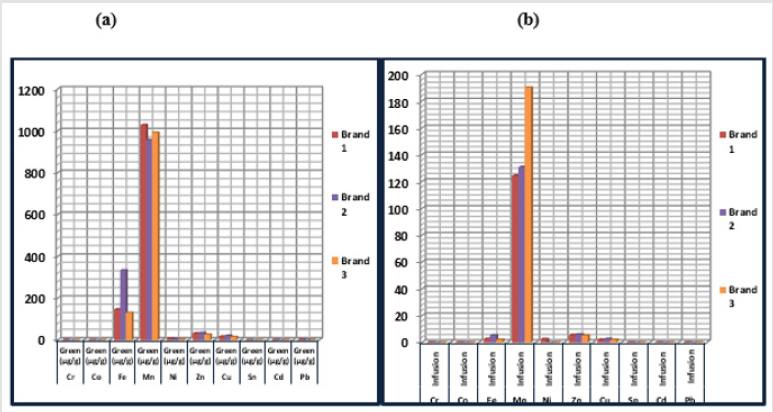
Figure 2: Mean concentrations of heavy metals in: (a) green tea samples in (μg/g) (b) green tea infusions in (μg/100 ml).
The results in Figure 3, show that the concentrations of heavy metals in brand (1) in herbal tea possess the highest concentration of studied heavy metal including Fe and Zn (556.8 ± 38.76 μg/g - 33.5 ± 0.32 μg/g) and (2.3 ± 0.1 μg/100 ml - 3.77 ± 0.33 μg/100 ml) in both digested and infused samples, respectively. In Brand (2), possess the highest concentrations of studied heavy metals including Mn (53.87 ± 0.36 μg/g) and (6.12 ± 0.42 μg/100 ml) in both digested and infused samples, respectively. Fortunately, the concentrations of toxic heavy metals Pb and Cd were too low in comparison to other concentrations of heavy metals in all tea digested and infused samples. On the other hand, the concentrations Co and Sn were less than Limit of Quantitation (LOQ) in both digested and infused samples, while the concentrations of Cu and Cr were too low to be detected in infused samples.
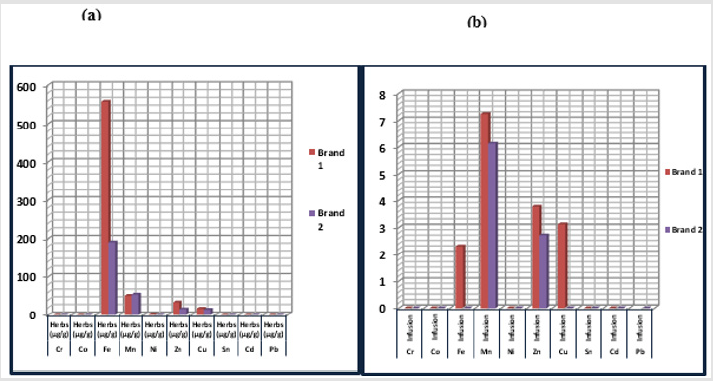
Figure 3: Mean concentrations of heavy metals in:(a) herbal tea samples in (μg/g) (b) herbal tea infusions in (μg/100 ml).
Chronic Dietary Exposure Assessments for Maximum Metal Concentrations in Black, Green and Herbal Tea Infusions
Due to the lack of information considering the maximum allowable levels of heavy metals in tea samples, chronic dietary exposure assessment was performed by comparing the maximum result of heavy metal from all analyzed tea infusions with accepted provisional daily intake (APTWI) for an actual determination of metal concentration reaching the body through drinking tea in Tables 6-8. The results confirm the expected calculated intake of all tested elements taken per week. Mn shows the maximum intake (0.07 mg/kg/bw/week) in all tea infused samples after comparing the result to APTWI of Mn (77 mg/kg/bw/week). Fortunately, Mn concentration was much lower than those concentrations (APTWI) set by JECFA which didn’t assess any risk to human regarding dietary exposure to black tea infusions considering exposure from air, food and water. One of the goals of our study, is evaluating the risk of heavy metal exposure as there are very limited studies about comparing the results with APTWI standards in comparison to other studies [22].
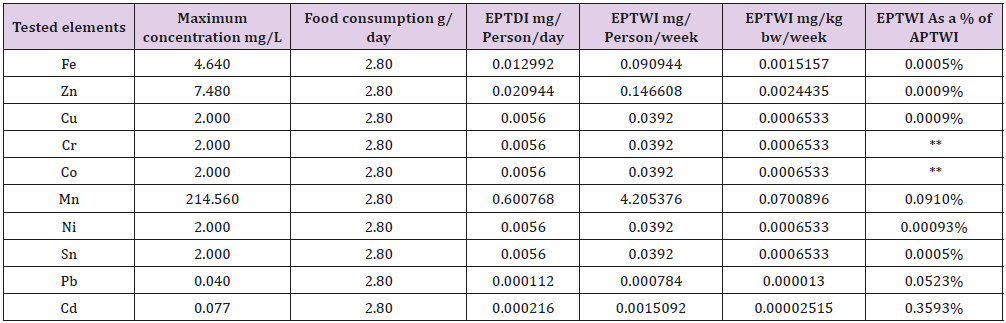
Table 6: Chronic dietary exposure assessment in black tea infusions.
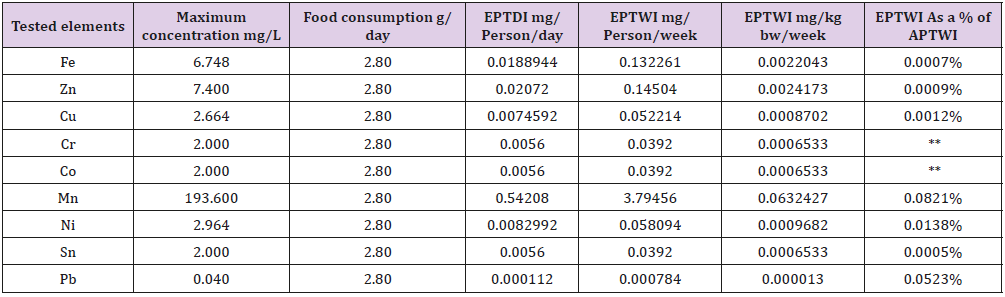
Table 7: Chronic dietary exposure assessment in green tea infusions.
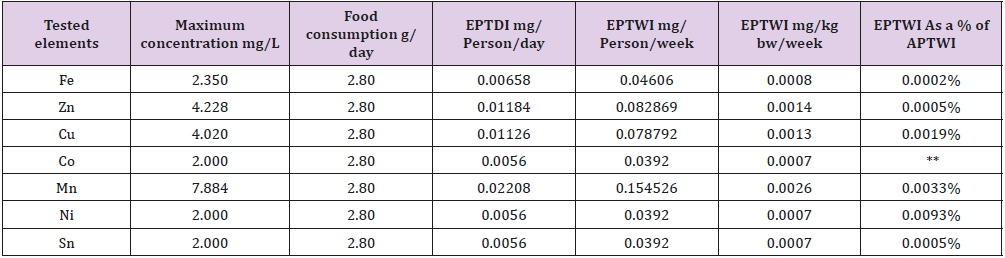
Table 8: Chronic dietary exposure assessment in herbal tea infusions.
Note: ** : No Data Obtained
EPTDI: Estimated Provisional Tolerable Daily Intake
EPTWI: Estimated Provisional Tolerable Weekly Intake
APTWI: Accepted Provisional Tolerable Weekly Intake
In conclusion, this study allows the determination of the presence of heavy metals, namely, Cadmium, Lead, Zinc, Chromium, Copper, Cobalt, Manganese, Iron, Tin and Nickel, in black, green and herbal tea, and to compare the levels acquired, if any, to the maximum allowable limits stated by (JECFA) [15]. The study used several brands of true and herbal tea with different production dates. The results show that only small part of heavy metal concentration of both herbal and true tea samples may brought into beverage (package), while the higher concentration remain in the solid particles during beverage preparation. Thereby, much care should be paid to how to get rid of the residual particles to avoid wide spreading of these metals in the environment. All tea and herbal brands available in markets contain considerable concentrations of the studied heavy metals. Fortunately, the concentrations of toxic heavy metals i.e. Pb and Cd in tea and herbal samples were too low whether in digestion or infusions. Instead, the considerable concentration recorded for other non-toxic metals lie within acceptable provisional weekly intake from air, food and water of these elements.
There should be information for specifying the acceptable concentration of heavy metals in tea and herbal leaves and the maximum allowable and safe concentration of each metal in tea leaves is urgently needed. Therefore, occasional check and frequent analysis of foodstuff is recommended with an intention to avoid any risk that arise from intake beyond the tolerance limits standards. Additionally, this study can be used as a reference for future in depth studies. This research can serve as an eye opener to consumers, manufactures, and the professionals in the health care system due to possible direct or cumulative effects it may cause if high concentration is present.
Acknowledgement
The authors would like to convey their sincere gratitude to all academic staff of Faculty of Biotechnology, October University for Modern Sciences and Arts and The Central Laboratory of Residue Analysis of Pesticides and Heavy Metals in Food (QCAP), Agriculture research Centre (ARC), Egypt for their endless support and help.
References
- Zhong W, Ren T, Zhao L (2015) Determination of Pb (Lead), Cd (Cadmium), Cr (Chromium), Cu (Copper) and Ni (Nickel) In Chinese Tea With High-Resolution Continuum Source Graphite Furnace Atomic Absorption Spectrometry. J Food Drug Analysis 24(1): 46-55.
- Rashid MH, Fardous Z, Chowdhury MA, Alam MK, Bari ML, et al. (2016) Determination Of Heavy Metals In The Soils Of Tea Plantations And In Fresh And Processed Tea Leaves: An Evaluation Of Six Digestion Methods Chemistry Central J 10(7): 1-13.
- Brzezicha Cirocka J, Grembecka M, Szefer P (2016) Monitoring Of Essential And Heavy Metals In Green Tea From Different Geographical Origins Environmental Monitoring and Assessment 188(3): 183.
- Narin I, Colak H, Turkoglu M, Soylak M, Dogan (2004) Heavy Metals In Black Tea Samples Produced In Turkey Bull Environ ContamToxicol 70: 844-849.
- Al Oud, SS (2003) Heavy Metal Contents In Tea And Herb Leaves Pakistan Journal Of Biological Sciences 6(3): 208-212.
- Raymond AW, Okieimen FE (2011) Heavy Metals In Contaminated Soils: A Review Of Sources, Chemistry, Risks AndBest Available Strategies For Remediation ISRN Ecology 20(1): 20.
- Reda AAS, Hanan RAA, Khaled AG, Hassan MG (2007) Heavy Metals In Soils And Plants From Various Metal-Contaminated Sites In Egypt. J food Drug Analysis 1(1).
- Al Naggar YA, Naiem YA, Seif AI, Mona MH (2014) Metals In Agricultural Soils And Plants In Egypt Mellifera 96(5): 730-740.
- Mokhtar S, Agroudy NEl, Shafiq FA, Yassin H, Fatah A (2015) The Effects Of The Environmental Pollution In Egypt. International J Environment 4(1): 21-26.
- El Gammal MI, Ali RR, Samra RMA (2014) Assessing Heavy Metal Pollution In Soils Of Damietta Governorate, Egypt. International Conference On Advances In Agricultural, Biological Environ Sci 1(1): 116-124 li class="ref">Mahmoud MG, Mona AK, Eglal RS (2019) Optimization and Validation of an Analytical Method for the Determination of Some Trace and Toxic Elements in Canned Fruit Juices Using Quadrupole Inductively Coupled Plasma Mass Spectrometer. J AOAC Int 102: 262-270.
- Yang MH, Yuh chang Sun, yu Teh Chung, Jerzy Mierzwa (1999) Comparative Determination Of Ba ,Cu , Fe , Pb And Zn In Tea Leaves By Slurry Sampling Electrothermal Atomic Absorption And Liquid Sampling Inductively Coupled Plasma Atomic Emission Spectrometry Talanta 47(5): 1263-1270.
- Mostafa MHK, Mona AK, Mahmoud MG (2016) Development of Analytical method for Determination of some essential and toxic elements in some canned and homemade baby food samples in Giza. Res J Chem Environ Sci 4: 15-23.
- Chen WH, Shen MF (2008) Element Composition Of Tea Leaves And Tea Infusions And Its Impact On Health Bull Environ Contam Toxicol 80: 300-304.
- WHO/FAO Joint Expert Committee OnFood Additives (2005) Evaluation Of Certain Food Contaminants, p. 8-17.
- Soliman NF (2016) Health Economics &Outcome Research : Metals Contents In Black Tea And Evaluation Of Potential Human Health Risks To Consumers. Health Economics Outcome Res 2(1): 2-5
- Satsananan C (2016) The Study of The Amounts Of Heavy Metals In Green Teas Determine By Using Atomic Absorption. International J Systems Applications, Engineering Development 10(1): 20-24.
- Wang J, Nakazato T, Sakanishi K, Yamada O, Tao H, et al. (2004) Microwave Digestion with HNO3/HNO2 Mixture at High Temperature for Determination of Trace Element in Cool by ICP- OES Analytical Chimica Acta 5(41): 115-124.
- Karimi G, Hasanzadeh MK, Nili A, Khashayarmanesh Z (2008) Concentrations And Health Risk Of Heavy Metals In Tea Samples Marketed In IRAN. Pharmacologyonline 3: 164-174.
- Khalid RS, Alaama M, Abbas SA (2016) Main Analytical Techniques Used For Elemental Analysis in, 15(February). Tropical J Pharmaceutical Res 15(2): 427-434.
- Esra A, Huseyin A, Mustafa T (2014) Determination of multi element levels in leaves and herbal teas from turkey by icp-oes. Bull Chem Soc Ethiop 28(1).
- Cruz CG, Din Z, Feri DC, Balaoing MA, Gonzales ME, et al. (2009) analysis of toxic heavy metals (arsenic, lead, and mercury) in selected infant formula milk commercially available in the philippines by aas E-International Scientific Research J 1(1): 40-51.
