 Research Article
Abstract
The evaluation of haematological parameters is an important tool that can be used as an efficient index for monitoring physiological and pathological changes in humans. This study was designed to determine the correlation between haematological parameters by automated hematology analyzed with the manual methods. Human venous blood (5 ml) was collected from healthy volunteers in a vacutainer containing EDTA using a sterile syringe for the analysis of haematological parameters using the automated and the manual methods. Haematological parameters such as RBC, WBC and platelets counts, percentage of neutrophils, lymphocytes, monocytes, eosinophils and basophil, haemoglobin, haematocrit, MCV, MCH and MCHC were determined at different time intervals (0 hour-24 hours) using manual and automated methods. The results of this study indicated that the shorter the duration between collection of sample and analysis the most sensitive is the result. Between the manual and automated analysis, the accurate result was obtained from automated analysers representing even minute variations. From the present study, it can be concluded that the automated hepatology analyzer readings correlated well with readings by the standard manual method, although the latter method gave additional diagnostic information on the blood pictures. While patients’ care and laboratory operations could be optimized by using manual microscopic examination as a reflective substitute for automated methods, usage of automated method would ease our workload and save time for patients.
Keywords: Haematology; Automated Analysers; Haemocytometer; Leishman Stain
Introduction
The assessment of haematological characteristics is an important tool that can be used as an efficient index for monitoring physiological and pathological changes in humans. Haematological analysis, although regularly used in testing, provides fundamental information about the levels of stress, metabolic disorders, reproductive dysfunctions and diseases. Earlier studies on haematological parameters revealed that the interpretation of blood parameters is quite difficult, because variations in the blood are caused by both internal and external factors. In particular, it is well known that blood sampling, laboratory techniques, seasonal variations, size, genetic properties, sex, population density, lack of food supply, environmental stress and transportation can all affect haematological parameters [1]. Accurate measurement of haematological analytes is essential for correct interpretation of haematological disorders in both clinical and research fields. Since prolonged sample storage can be a pre-analytical source of variability, it is recommended that haematological analyses can be performed shortly after blood collection. Delayed sample analysis is not a rare circumstance in clinical and laboratory practice, especially when blood samples are taken to distant centralized laboratories, when the analysis cannot be readily performed, or when retesting is appropriate. Thus, issue of correct results is very important for correct interpretation and diagnosis [2,3].
Haematology & Haematological Parameters
The term haematology was derived from the Greek word “haima” means “blood”, and is the study of blood, the bloodforming organs and blood diseases. It includes the study of etiology, diagnosis, treatment, prognosis and prevention of blood diseases that affect the production of blood and its components, such as blood cells, haemoglobin, blood proteins and the mechanism of coagulation.
Blood is made of two parts
a) Plasma which makes up 55% of blood volume and
b) Formed cellular elements (red blood cells, white blood cells, and platelets) which combine to make the remaining 45% of blood volume.
The haematological parameters are
a. Red Cell Count- a total count of the number of red cells per litre of blood.
b. Haemoglobin (Hb)- the total amount of haemoglobin in the blood.
c. Haematocrit (HCT)/ Packed Corpuscular Volume (PCV)- the ratio of total volume of the packed red cells to the total blood volume.
d. Mean Corpuscular Volume (MCV) is an indication of the size of the red cells.
e. Mean Corpuscular Haemoglobin(MCH) is a measure of the amount of haemoglobin per red blood cell.
f. Mean Corpuscular Haemoglobin Concentration (MCHC) is the amount of haemoglobin per liter of fluid in each cell. The six types of WBCs are split in to two major categories, granulocytes and agranulocytes.
Manual Methods Versus Automated Analysers
The automated hematology analyzer with Complete Blood Count (CBC) results has replaced the traditional manual or individual assay methods for haematological parameters [4]. The traditional review of all automated hematology instrument results by preparation, staining and microscopic examination of a blood film has disappeared in most institutions [5]. The reasons are the more accurate detection of specimens with distributional or morphological abnormalities by the traditional eye count method [6]. There has also been a dramatic reduction of the numbers of medical technologists and technicians in medical laboratories. Automated complete blood count and differential counts has reduced the number of technologists needed for performance of these tests [7]. But other factors have had a negative effect, such as the necessity to reduce costs. Consolidation of hematology and chemistry laboratories in core laboratories may produce savings in labour costs but may also create problems of creating and maintaining areas of expertise.
Furthermore, hematology analyzers provide quick and accurate results in most situations. However, false results related either to platelets or other parameters from complete blood count may be observed in several instances, false low White Blood Cell (WBC) counts may be observed because of agglutination in the presence of Ethylenediamine Tetra-Acetic Acid (EDTA) [8]. Despite the sophistication of present-day instruments, there is still needed to depend on manual techniques for primary calibration. This highlights the importance of the need to maintain the manual technical skills, and to ensure this by appropriate technician training programme, despite the temptation to leave it all to the machines. Also, the correlation between automated hematology analyzer and manual techniques is rare and conflicting [9]. Hence, this present study was designed and conducted to determine the relationship between automated hematology analyzer and manual methods using randomly selected human subject’s blood samples at different time intervals (0, 2, 4, 6, 8, 10, 12 and 24 hours).
Materials and Methods
Blood Sample Collection and Analysis
Venous blood samples (5 ml) were randomly collected from healthy human subjects. Consent was obtained from each subject at the commencement of the study. The blood sample was collected aseptically from each subject into tri-potassium Ethylenediamine Tetra-Acetic Acid (K3EDTA) anticoagulant bottle. This was well mixed by gentle inversion for Complete Blood Count (CBC) analysis. Blood sample was divided into 2 parts as follows: Three (3 ml) for manual method and 2 ml for automated method using hematology auto analyzer ADVIA 120i - five pot instrument. All manual samples were analyzed using standard hematological method as described by Dacie and Lewis [10], while the automated analysis was done following the manufacturer’s operational guidelines. All samples were analyzed at 0, 2, 4, 6, 8, 12 and 24 hours after collection. Haemoglobin (Hb) was estimated by the cyan-methaemoglobin method: Packed Cell Volume was estimated by the microhaematocrit method: Total and differential leucocyte counts were done by visual method. Mean Cell Haemoglobin Concentration (MCHC) was calculated from a knowledge of the haemoglobin and PCV (Figure 1).
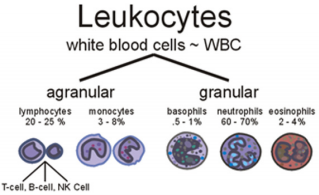
Figure 1: White Blood Cell types (www.med-health.net).
Blood Smear and Leishman Staining
A thin smear of blood is prepared on following the protocol onto a glass slide, stained, and examined under a microscope to record the appearance and nature of the cellular components. The two slides are cleaned using 70% alcohol, one to be covered with the blood film and one to be as spreader. Using a micropipette, a drop of blood was placed on a slide and made a fine touch of one end of a slide with blood. The edge of another slide was placed on the surface of the first one at angle of 45 degree. The spreader was drawn back until it contacted the drop of blood. Spreader was pushed slowly to the other end of the slide making a thin film and the film was allowed to dry at room temperature. Leishman’s stain was dropped on to blood film and allowed to stay for 1-2 minutes. Then distilled water was added to the stain and should be allowed to act for 15-30 minutes. Again, the slide was washed with distilled water. The excess water was dripped on to the tissue paper and allowed to dry at room temperature. Then the slide was examined in microscope using low power objective and by placing a drop of immersion oil on the selected area and use oil immersion objective. The differential cell counts, and morphology of WBC’s were examined (Figure 2).
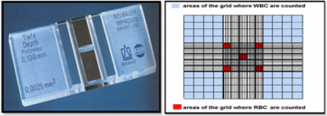
Figure 2: Neubauer counting chamber and counting area.
Data Analysis
The SPSS 16 software was used in the statistical analysis. A p-value of less than 0.05 (p < 0.05) was considered significant.
Results and Discussion
The results obtained regarding RBC count (Figure 3), Tables 1 & 2 was statistically significant when measured with the automated method compared to the traditional manual method suggesting the passage of two or more RBC through the “flow cell”, which is called “coincidence” causing to obtain a higher number than in the sample [11]. Upon noticing the rates of haemoglobin concentration, it is also observed that they are increased in the samples when measured with the automatic method as compared to the traditional manual method (Figure 4), (Tables 1 & 2). Consistent with many other studies, the directly measured parameter of Hb concentration was stable with storage at refrigerator temperature for 24 hours. Similarly, the RBC counts were relatively stable throughout the 24 hours. The MCV increased from 6 hours to 24 hours. This phenomenon is consistent with the erythrocyte swelling that has been described in previous stability studies of rat, dog, cat and human blood parameters using both impedance and optical technology. The increases of MCV lead to consequent changes in calculated values dependent on the measured MCV value.
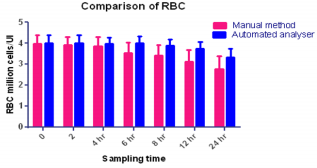
Figure 3: Comparison of RBC- Manual Vs Automated analyser.
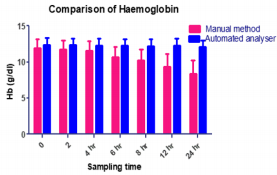
Figure 4: Comparison of Haemoglobin- Manual Vs Automated analyser.
Platelet counts in this study significantly increased by six hours. These findings are not consistent with other studies in rats, dogs or humans, in which platelet counts were stable or decreased over time. In this study, increased platelet aggregation was observed on the blood smears over time; however, this was not reflected as a decrease in the automated platelet counts. Erythrocyte microcytes or fragments may be counted as platelets when impedance technology is used for platelet and erythrocyte enumeration. This explanation, however, seems very unlikely as the cause for the observed increases in platelet numbers because the RBC counts remained stable, the MCV increased and no erythrocyte fragments (e.g., schistocytes) were observed on the blood smears. Regardless of the reason, platelets should be measured shortly after blood collection, as there was substantial increases 6 hours post collection. The MPV remain unchanged in manual method at 6 hours with subsequent increases, thereafter, probably representing an initial slight shrinkage with a combination of platelet swelling and aggregation contributing to the subsequent increases. The WBC count was stable for 6 hours at refrigerator temperatures (Figure 5) and (Tables 1 & 2).
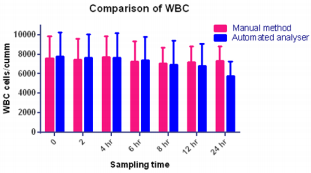
Figure 5: Comparison of WBC count - Manual Vs Automated analyser.
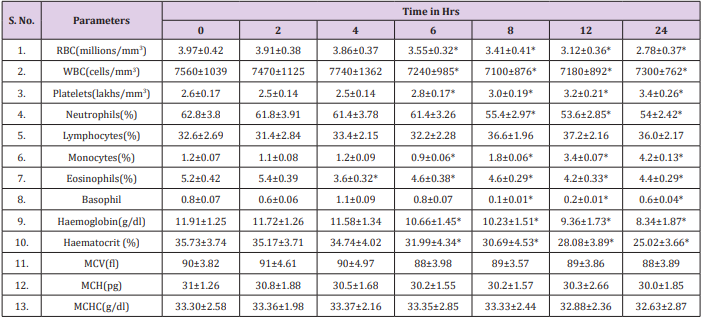
Table 1: Haematological parameters analysed by Manual method (0 -24 Hrs).
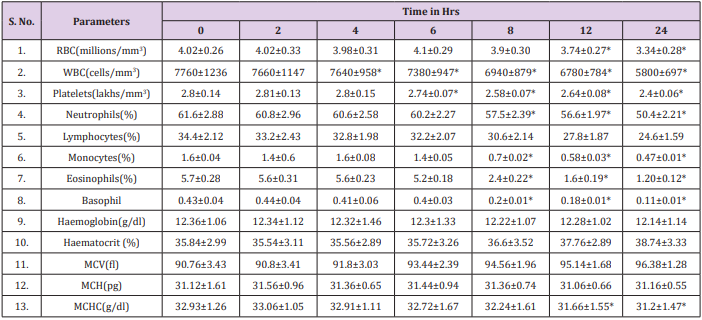
Table 2: Haematological parameters analysed by Automated method (0 -24 Hrs).
These findings were accompanied by significant decreases in the WBC and monocytes starting at 6-8 hours at refrigerator temperature as well as a downward trend in eosinophils. Although all leukocytes can degenerate with storage, the findings of this study suggest that lymphocytes and neutrophils are more stable than monocytes and eosinophils. Further studies are needed to assess the stability of leukocytes as measured by automated haematology machines. Also, this agrees with an earlier report by Takubo and Tatsuni [12] whose result indicated discrepancies in a Quality Control (QC) survey in a manual leucocyte differential count which was attributed to poor differentiation of segmented neutrophils and band neutrophils. As expected, significant increases in smudge cells occurred progressively over time in this study. It may be that the formation of smudge cells affected the results of the manual WBC differential count performed for this study which may explain the changes observed in individual leukocyte percentages, as different leukocytes may degenerate at different rates. Much like smudge cells, the finding of increased pyknotic leukocytes over time was expected. It is well known that pyknotic leukocytes can form from prolonged blood sample storage. Echinocytes, or cremated erythrocytes, and spheroechinocytes are also wellknown phenomenon of prolonged blood storage and have been well documented in literature.
Conclusion
The results of the present study confirm that the automated hematology analyzer readings are as reliable as the standard manual method even though the latter method gives additional diagnostic information through the blood pictures. Hence, manual microscopic blood examination should always be used to validate the automated methods as previously suggested by Lantis [13]. Delayed analysis of blood samples produces artifactual changes, notably in MCV, PCV, platelet count, MPV and red blood cell morphology. The best practice is to measure hematologic parameters shortly after collection. In the event of delayed analysis, specimens should be stored in the refrigerator and care must be taken not to misinterpret artifactual changes as pathologic findings.
References
- Bunn HF (2011) Approach to the anaemias (24th edn.), Cecil medicine, Philadelphia, Saunders Elsevier
- Sethi B, Taylor J, Mitchell P (2010) Stability of hematology parameters on the LH 750: Comparison of Sarstedt Monovettes and BD vacutainers. Br J Biomed Sci 67(3): 113-119.
- Cohle, SD, Saleem A, Makkaoui DE (1981) Effects of storage of blood on stability of hematological parameters. Am J Clin Pathol 76: 67-69.
- Lantis KL, Harris RJ, Davis G, Renner N, Finn WG (2003) Elimination of instrument-driven reflex manual differential leucocyte counts. Optimization of manual blood smear review criteria in a high-volume automated hematology laboratory. Am J Clin Pathol 119(5): 656-662.
- Pierre RV (2002) Peripheral blood film review: The demise of the eye count leucocyte differential. Clin Lab Med 22(1): 279-297.
- Novis DS, Walsh M, Wilkinson D, St Louis M, Ben-Ezra J (2006) Laboratory productivity and the rate of manual blood smear review: College of American Pathologist Q-Probes Study of 95,141 complete blood count determinations performed in 263 institutions. Arch Pathol Lab Med 130 (5): 596-601.
- Rock WA, Miale JB, Johnson WD (1984) Detection of abnormal cells in white cell differentials: Comparison of the HEMATRAK automated system with manual methods. Am J Clinical Pathology 81(2): 233-236.
- Zandecki M, Genevieve F, Gerald J, Gordon A (2007) Spurious counts and spurious results on hematology analysers. International Journal of Laboratory hematology 29(1): 21-41.
- Ike SO, Nubila T, Ukaejiofo EO, Nubila IN, Shu EN, et al. (2010) Comparison of haematological parameters determined by the Sysmex KX - 2IN automated haematology analyzer and the manual counts. BMC Clin Pathol 23: 10-13.
- Dacie JV, Lewis SM (1995) Practical Haematology. Churchill Livingstone, New York, pp. 609.
- Lee SE, Lim J, Kim Y, Min WS, Han K (2012) Leucocyte cell population analysis from the coulter automatic blood cell analyzer DxH800 to monitor the effect of G-CSF. J Clin Lab Anal 26(3): 194-199.
- Takubo T, Tatsumi N (1990) Quality control in a manual and an automated leukocyte differential count. Southeast Asian J Trop Med Public Health 30(suppl 3): 66-74.
- Med-Health.net
