 Research Article
Abbreviations: HF: Heart failure; NSTEMI: Non-ST-Segment Elevation Myocardial Infarction; CT: Compu ted Tomography; ROI: Region of Interest; VOI: Volume of Interest; AUC: Area Under the Curve
Introduction
Heart failure (HF) is associated with increased mortality in patients with non-ST-segment elevation myocardial infarction (NSTEMI) [1]. The pathophysiology behind is myocardial ischemia leading to cardiac dysfunction, elevated left ventricular filling pressures, accumulation of of fluid in the lungs [2] and, in severe cases, pulmonary edema [3]. However, most patients with NSTEMI do not display obvious signs and symptoms of heart failure despite cardiac dysfunction. Instead they have subtle symptoms and signs where clinical evaluation and chest x-ray have low sensitivity [4] and low interobserver reproducibility [5,6]. Thus, identifying heart failure accurately in patients with subclinical congestion is a major clinical challenge as well as an unmet need. Computed tomography (CT) evaluation of congestion is considered superior to chest x-ray, but restricted due to relative high radiation exposure [7]. Cardiac CT however is expanding rapidly and on the verge of becoming first diagnostic test in patients with NSTEMI [8,9]. We have previously examined qualitative signs of congestion from Cardiac-CT images in NSTEMI patients and found that even modest qualitative CT signs of heart failure were associated with adverse prognosis [10]. However, qualitative assessment of radiographic CT signs of congestion requires an in-house specialist, time consuming and is subject to interobserver variability [10].
Quantitative lung computed tomography is a well-known non-invasive technique that has been used objectively to assess lung involvement in interstitial lung disease [11]. Quantitative CT derived lung attenuation density was strongly correlated to the development of pulmonary edema in experimental animal studies [12] and previous studies suggested that a quantitative CT assessment may detect subclinical pulmonary congestion [13,14]. The potential prognostic and therapeutic value of detecting subclinical pulmonary congestion from already performed CT scans warrant a study to investigate the best way to perform quantitative CT analysis in terms of diagnostic accuracy and reproducibility. Thus, we designed a proof of concept case control study to examine the reproducibility and diagnostic value of different quantitative CT methods in patients with and without definite signs of heart failure after NSTEMI. We hypothesized that patients with NSTEMI and definite heart failure prior to the CT-scan would have a higher lung density, than patients with NSTEMI and no clinical signs of heart failure. The objective was to examine which of the previously described quantitative CT based methods are best to discriminate patients with and without overt signs of heart failure after NSTEMI, and to determine which method has the best intra- and interobserver variability.
Methods
Population
Patients were identified from a previously examined population of 371 low-risk NSTEMI patients who underwent gated, 64-slice MDCT coronary angiography to assess the clinical value of MDCT coronary angiography. In- and exclusion criteria have been described previously [9] In brief, patients had been included if they had NSTEMI and they were excluded if they had a contraindication to CT, such as history of chronic renal disease or plasma-creatinine >125 μmol/l, cardiac arrhythmia, known allergy to iodine contrast, hemodynamic instability, respiratory distress or pulmonary edema leading to inability to lie still in supine position. From this previously examined population we identified two subset groups of patients with either definite heart failure (cases) or no signs of heart failure (control).
Definition of Heart Failure and Control Group
Cases were patients who had been treated for clinical heart failure within five days before examination and required all of the following criteria: Killip class 2 or 3 within 5 days prior to CT, at least one significant stenosis in one of the three major branches on coronary angiogram and LVEF < 45% assessed by echocardiography. Control patients had no heart failure based on the following criteria: Killip class 1, (i.e. no clinical signs of heart failure in previous 5 days), no significant coronary artery stenosis (i.e. less than 50% luminal stenosis) and LVEF > 55 %. Patients with obvious non-cardiogenic pathologies (bullae, pneumonia, interstitial lung disease) on the CT scan and patients with inappropriate image quality of pulmonary CT scan due to (filter, artifact, respiration, and incomplete lung delineation) were excluded.
CT Imaging
All patients were scanned in the supine position during a single breath-hold with tidal inspiration during scanning on a 64-slice CT scanner (Toshiba Aquillion, Japan) using retrospective gating. The scan parameters were: Tube voltage 120-135 kV, tube current 380-450 mA, detector collimation 64 x 0.5 mm, and rotation time 350-500 ms. Depending on the expected scan time 70-100 ml of contrast agent (Visipaque 320, GE Healthcare, UK) was infused with a rate of 5 ml/s. Computer-assisted bolus tracking program was used to synchronize the start of scanning with contrast arrival in the descending aorta using a threshold of 180 HU. We used a late diastolic image defined as the phase with least cardiac motion as determined by an automatic raw data motion analysis tool (PhaseXact, Toshiba), reconstructed with a large field of view and a slice thickness and increment of 3 mm using a standard medium soft kernel. The dataset was transferred to an external workstation (Vitrea, version 6.2, Vital, Minnesota, USA) for further analysis blinded to clinical information.
Quantitative Lung CT Measurement
Quantitative CT relies on the close relationship between the physical density of the lung tissue and the attenuation density measured by CT and expressed in the Hounsfield units scale (HU) [15]. By assuming a constant attenuation density of tissue of aqueous density (0 HU) and air (-1000 HU) radiographic density can be used to assess water content in a predefined region of interest (ROI) or volume of interest (VOI). Two principally different CT methods have previously been described. Earlier studies used a 2-dimensional slice method with one or two axial images with peripherally placed ROI as a surrogate for the whole lung, while newer studies have used 3-dimensional method based on VOI of parts or the entire lung. The diagnostic value of each method was compared by their ability to identify cases and controls. The intraand interobserver reproducibility was assessed by repeating the measurements. Two quantitative CT protocols were selected based on previously described protocols. A “2D-slice” (Figure 1) method and a “3D method” (Figure 2).
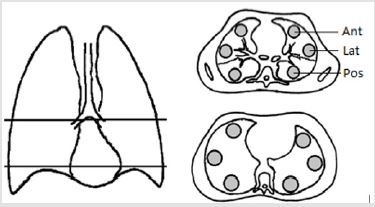
Figure 1: Region of interest and slice placement – 2D slice method.
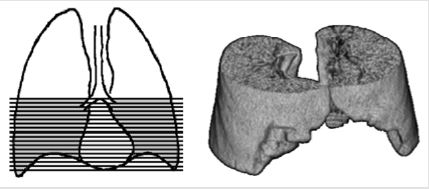
Figure 2: Volume of interest definition - 3D method.
2D-Slice Method
Two 2D slices were created: A mid thoracic 2D-slice was defined as the highest possible slice, where two separate main bronchi could be identified; a base 2D-slice was defined as the lowest possible slice clearly above the diaphragm [3,4]. In each 2D-slice three circled regions of interest (ROI), each approximately 10 cm2 (equivalent to 2500 pixels) were manually placed in the peripheral anterior, posterior and lateral parts of the lung parenchyma 0.5 cm apart from the pleura, as previously proposed [16] (Figure 1). We calculated the anterior to posterior ratio, anterior to lateral ratio, lateral to posterior ratio and finally the anterior to posterior gradient by subtracting the average attenuation density in the respective ROI [17].
3D-Method
The 3D protocol defined the volume of interest (VOI) as all parenchyma within the pleura including all subsegmental vessels and bronchi within the scan field from carina to diaphragm (Figure 2). The software lung segmentation tool performed the reconstruction. The automatic segmentation of the lung was manually adjusted to accurately cover the defined VOI. Mean lung density for both lung fields as well as for the right and left lung field was assessed. In addition, VOI of left upper and lower lobe within the scan field was defined, which allowed interlobar comparisons.
Qualitative Assessment
To identify patients with and without obvious qualitative CT signs of pulmonary congestion, two readers blinded to all clinical information and to each other assessed the following 6 CT findings: vascular increase, ground glass opacity, airspace consolidation, interlobular septal thickening, peribronchovascular thickening, and pleural effusion [18,19] (Table 1). The readers were one a research fellow who had been trained to read pulmonary chest CT and one consultant radiologist. An integrated conclusion classified CT scans into “Obvious”, “Probable” or “No” congestion based on these qualitative CT findings indicative of congestion: “Obvious congestion” required that two readers had agreed on the presence of at least two signs; “No congestion” required that the two readers both agreed on no signs of congestion; “Probable congestion” referred to the rest where there was disagreement or agreement of just one sign present.
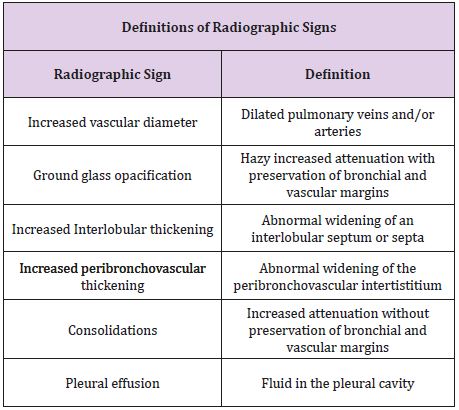
Table 1: Definitions of radiographic signs.
Statistical Analyses
Study size was estimated based on a previous study of quantitative CT in congestive heart failure where there was a difference in lung density from NYHA I to NYHA II of 10% [14]. Normal values of whole lung VOI has been reported at -840 HU±30 HU [20]. A 10% increase in lung density with a power of 80 % power and alpha 0.05 would correspond to 4 patients in each group. Continuous normal distributed variables were presented as mean ± SD. Categorical variables were presented as frequencies and percentages. For statistical comparisons, a paired Student t test for independent samples was used for continuous values, and the chi-square test was used for categorical variables. Continuous variables that were not normally distributed were compared with the Kruskal-Wallis test. The diagnostic value was evaluated by comparing cases and controls with area under the curve (AUC). By identifying optimal cut point based on Youden index odd ratios were calculated for the diagnostic value. The chi-square test was used for statistical comparisons. Interobserver variability of qualitative signs of pulmonary congestion was assessed with Kappa statistics. Two investigators using the Bland-Altman method assessed Interobserver and Interobserver variability of all quantitative method. Statistical analysis was performed using STATA version [13].
Results
Patients
From the initial population of 371 patients 15 patients had definite heart failure according to our criteria but three were excluded because of incomplete lung delineation, bullae and pneumonia. 30 patients fulfilled the criteria for the control group but [14] were excluded for technical reasons (12 with incomplete lung delineation and 2 with motion artifacts), while 3 had different lung pathology (2 with bullae and 1 with pneumonia). Hence 12 cases and 13 control patients were available for the present study (Table 2).
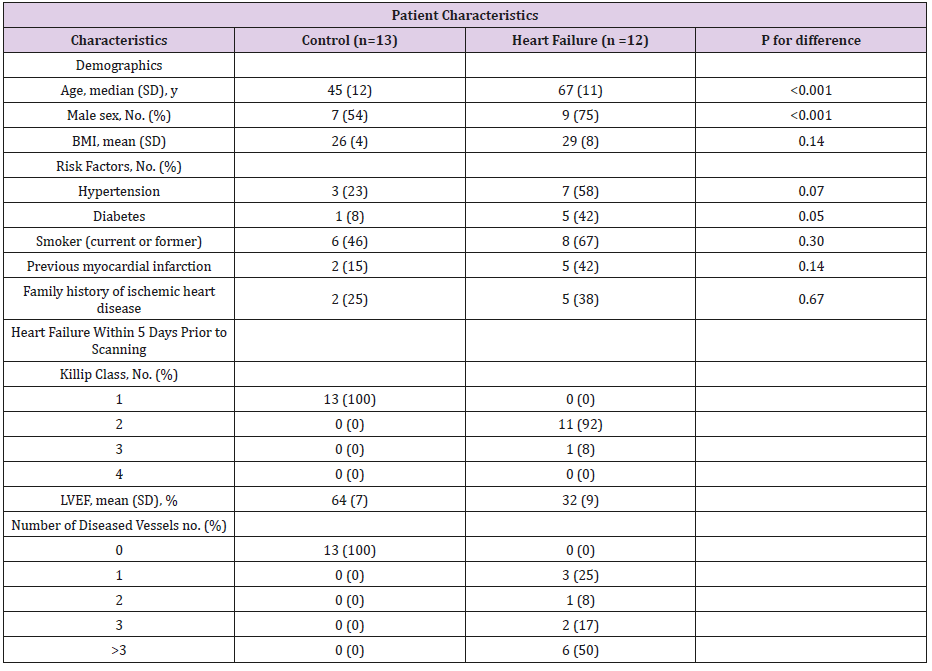
Table 2: Patient Characteristics.
BMI; Body Mass Index, LVEF; Left ventricular ejection fraction, SD; standard deviation.
Qualitative CT Protocol
86% of heart failure patients and 38% of the controls had at least one qualitative sign of congestion on CT by one of the two readers. Ground glass opacity was the most frequent radiographic sign in both groups. The interobserver variability for the integrated conclusion of “no congestion” was found with a kappa value of 0.82, for “probable congestion” of 0.60 and for “definite congestion” of 0.43 (Table 3).
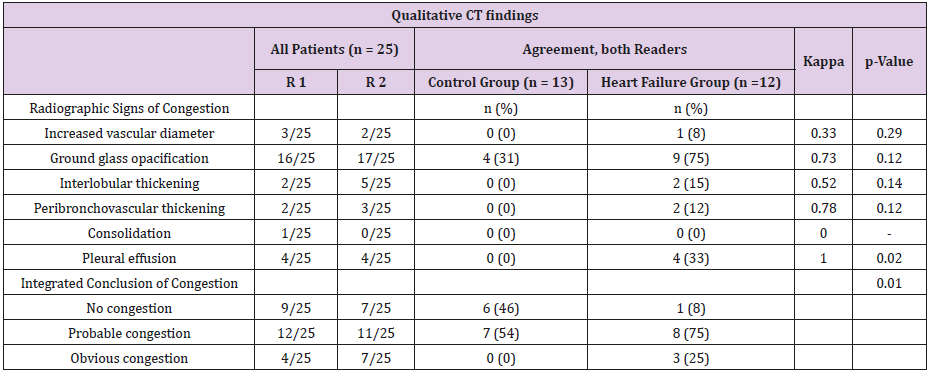
Table 3: Qualitative CT findings.
R1; Reader 1, R2; Reader 2, p value for difference between the groups. No congestion means no signs of congestion by both readers; obvious congestion means more than one sign of congestion by both readers; probable congestion means the rest of the patients.
Quantitative 3D Protocol
Left and right lung had similar mean density (left minus right, -Δ16 HU p=0.31). The heart failure group had higher density than the control group (Δ 76 HU, p<0.001) (Table 4). Density was higher in the lower than the upper lobe in control group (Δ75 HU, p<0.0006) as well as the heart failure group (Δ60HU, p<0.001), when examining left lobes in all patients.
Quantitative 2D Protocol
The posterior ROI had the highest density in relation to lateral and anterior ROI (Table 4). The carina and diaphragm slices had comparable density for anterior, lateral and posterior ROI in the heart failure group (Δ19HU, p=0.38, Δ11HU, p=0.70, Δ21HU, p=0.45) as well as the control group (Δ27HU, p=0.08, Δ19HU, p=0.22, Δ39HU, p=0.10) (Table 4).
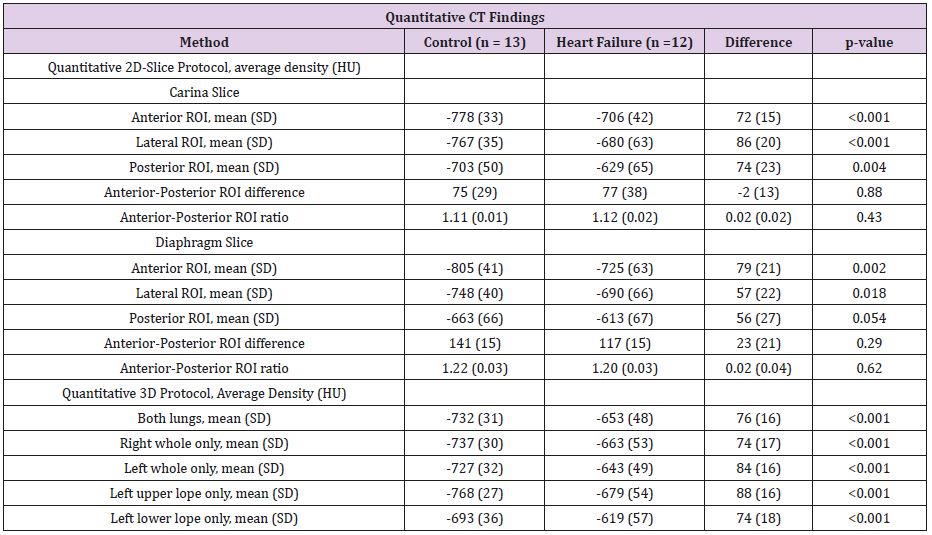
Table 4: Quantitative CT findings.
HU, Hounsfield Units, SD; standard deviation, ROI; Region of Interest.
Diagnostic Accuracy
ROI’s from anterior and lateral carina slices had the highest diagnostic value for detecting HF, while ROI’s from the diaphragm slice and the posterior ROI were weakest. The 3D methods showed higher numerical AUC and odds ratios than to the 2D methods. The left upper lope VOI had higher odds ratios than the left lower lope VOI (Table 5).
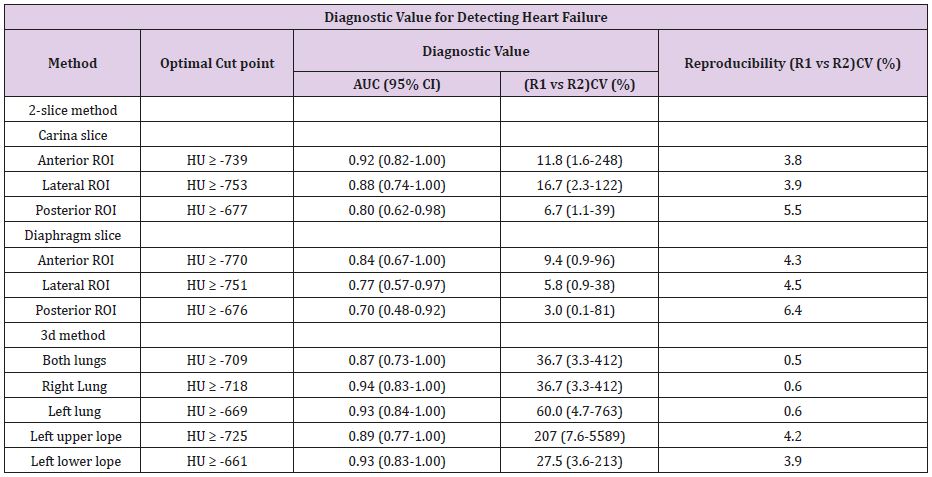
Table 5: Diagnostic value for detecting heart failure.
Reproducibility
The reproducibility of the semi-automated left and right lung VOI was excellent with interobserver and interobserver variability of less than 1.0 % (Table 5). This was superior to the manually traced ROI methods and upper and lower left lope VOI methods, which demonstrated, interobserver variability varying from 3.9% to 6.4% (Table 5).
Comparison of Quantitative and Qualitative Methods
Just three patients in the heart failure group demonstrated obvious congestion based on qualitative CT signs (Table 3). The majority of heart failure cases were classified as “probable congestion” (n =8), but the same was also observed for [7] controls subjects. We therefore compared average density of both lungs in relation to the readers’ evaluation of congestion (Figure 3). For patients with “probable congestion” the mean difference was Δ63 HU (p= 0.01).

Figure 3: Comparison of qualitative and quantitative findings.
Discussion
This is the first paper to compare the accuracy and reproducibility of various quantitative CT methods to distinguish patients with and without heart failure in the setting of myocardial infarction. Our data indicate that the quantitative CT density method could be particularly useful in the majority of patients without obvious radiographic signs of congestion. We demonstrate a high inter- and interobserver reproducibility, especially when using the 3D methods, which has a better diagnostic performance than 2D methods. Traditionally, assessing pulmonary congestion on CT is based on recognition of characteristic CT signs that has been shown to be associated with increased filling pressure or pulmonary congestion. Previous studies on pulmonary edema identified those signs as: increased pulmonary vessel diameter in 10% to 88% of cases, ground glass opacity in 25% to 100% of cases, interlobular thickening in 71% to 100% of cases, peribronchovascular thickening in 30%-90% of cases, airway consolidation in 16% to 80% of cases and pleural effusion in 44% to 87% of cases [18,19,21,22]. Our study design selected patients with milder degrees of congestion, and therefore the frequency of abnormal CT signs was lower. This is a relevant selection bias as the quantitative 3D CT method will be most useful in patients where clinicians are not certain of the clinical signs.
In previous experimental animal models, the different quantitative CT methods have been closely correlated to extravascular lung water [23]. Similar results have been reported in humans with non-cardiogenic pulmonary edema [24,25]. In the present study the quantitative methods were excellent in differentiating between patients with and without clinical heart failure after a NSTEMI. We observed that the density in the anterior and cranial parts of the lung (carina slice, anterior ROI and left upper lope) seemed better to discriminate the two groups. This finding is in accordance with previous work where anterior lung density correlates better with pulmonary wedge capillary pressure than global or posterior lung density measurements [26]. Furthermore, upper lope ground glass opacity is better to differentiate between acute respiratory distress syndrome and cardiogenic pulmonary edema, rather than middle or lower lobe ground glass opacity [22]. Comparison of the qualitative and quantitative CT approach to pulmonary congestion has not previously been explored. The reproducibility of both quantitative and qualitative methods was each in accordance with previous studies [22,27]. The quantitative methods were both more reproducible and better to discriminate between the heart failure and control groups than the qualitative approach. Our result support previous quantitative CT studies in which increased radiographic density in heart failure patients was observed even though qualitative chest X-ray did not reveal any signs of pulmonary congestion [13,14].
Limitation
This study has several limitations. Firstly. Any new method developed to evaluate pulmonary congestion requires validation against established methods. The most widely used method is qualitatively interpreted chest x-ray while other indirect measures such as lung ultrasound or thermodilution have been proposed. We only had the qualitatively interpreted Cardiac CT scan and clinical evaluation to compare quantitative measure with which is sufficient to test out hypothesis but not to compare quantitative CT against established methods. Secondly. We used contrast enhanced Cardiac CT scan for quantitative CT analysis. The effect of iv contrast on lung density in Cardiac CT scans is unknown and while it undoubtedly affects the lung density and induces some noise to the analysis, we were able to test our hypothesis. Thirdly. Only a small proportion of patients fulfilled a priori selection criteria for definite clinical heart failure and being a control. The main reason for exclusion of patients was related to poor image quality as the CT scans had not originally been recorded for the purpose of lung field analysis. The low number of heart failure cases fulfilling our criteria was mainly due to a priori exclusion of patients with severe pulmonary edema who had not been scanned due to inability lie still in supine position during the recording. However, such patients would not be a diagnostic challenge and are therefore not relevant for the present hypothesis of identifying patients with subtle signs of heart failure. Nonetheless, the study had statistical power to test our hypotheses and to examine the reproducibility as a proof of concept. And finally, we did not adjust lung density for age and smoking history, which influence lung density measurements28. However, the heart failure group was older and had more smokers which would be expected to decrease lung density. We might, therefore, have underestimated the diagnostic value of the method.
Clinical Perspective
Cardiac CT is expanding rapidly, to include patients with possible ACS [29]. Ongoing studies are performing Cardiac CT in patients with ACS [30] in order to test the method in the triage of these patients, where and accurate assessment of sub-clinical heart failure could play an important role for risk stratification and treatment strategy of patients. In this setting our study suggests that assessment of pulmonary congestion using our method could be an interesting tool to assess congestion.
Conclusion
We evaluated quantitative CT methods for detection of pulmonary congestion in patients with myocardial. Our findings suggest that 3D evaluation based on pulmonary attenuation values may have a high diagnostic accuracy in detecting HF. Our study encourages further studies to examine the clinical value of this novel method in more diverse patients with shortness of breath or suspected heart failure.
References
- Bahit MC, Lopes RD, Clare RM, Newby LK, Pieper KS, et al. (2013) Heart failure complicating non-ST-segment elevation acute coronary syndrome: timing, predictors, and clinical outcomes. JACC Heart Fail 1(3): 223-229.
- Ware LB, Matthay MA (2005) Clinical practice. Acute pulmonary edema. N Engl J Med 353: 2788-2796.
- Kühl JT, Møller JE, Kristensen TS, Kelbæk H, Kofoed KF (2011) Left atrial function and mortality in patients with NSTEMI an MDCT study. JACC Cardiovasc Imaging 4(10): 1080-1087.
- Mant J, Doust J, Roalfe A, Barton P, Cowie MR, et al. (2009) Systematic review and individual patient data meta-analysis of diagnosis of heart failure, with modelling of implications of different diagnostic strategies in primary care. Health Technol Assess 13(3): 1-207.
- Badgett RG, Mulrow CD, Otto PM, Ramírez G (1996) How well can the chest radiograph diagnose left ventricular dysfunction? J Gen Intern Med 11(10): 625-634.
- Gadsbøll N, Høilund-Carlsen PF, Nielsen GG, Berning J, Brunn NE, et al. (1989) Symptoms and signs of heart failure in patients with myocardial infarction: reproducibility and relationship to chest X-ray, radionuclide ventriculography and right heart catheterization. Eur Heart J 10(11): 1017-1028.
- Lange N, Schuster D (1999) The measurement of lung water. Crit Care 3(2): R19-24.
- Goldstein JA, Chinnaiyan KM, Abidov A, Achenbach S, Berman DS, et al. (2011) The CT-STAT (coronary computed tomographic angiography for systematic triage of acute chest pain patients to treatment) trial. J Am Coll Cardiol Elsevier Inc 58(14): 1414-1422.
- Kühl JT, Hove JD, Kristensen TS, Norsk JB, Engstrøm T, et al. (2017) Coronary CT angiography in clinical triage of patients at high risk of coronary artery disease. Scand Cardiovasc J 51(1): 28-34.
- Kühl JT, Kristensen TS, Thomsen AF, Hindsø L, Hansen KL, et al. (2016) Clinical and prognostic correlates of pulmonary congestion in coronary computed tomography angiography data sets. J Cardiovasc Comput Tomogr 10(6): 466-472.
- Goldin JG (2002) Quantitative CT of the lung. Radiol Clin North Am 40(1): 145-162.
- Scillia P, Delcroix M, Lejeune P, Mélot C, Struyven J, et al. (1999) Hydrostatic pulmonary edema: evaluation with thin-section CT in dogs. Radiology 211(1): 161-168.
- Kato S, Nakamoto T, Iizuka M (1996) Early diagnosis and estimation of pulmonary congestion and edema in patients with left-sided heart diseases from histogram of pulmonary CT number. Chest 109(6): 1439- 1445.
- Morooka N, Watanabe S, Masuda Y, Inagaki Y (1982) Estimation of pulmonary water distribution and pulmonary congestion by computed tomography. Jpn Heart J 23(5): 697-709.
- Mull T, Army WR (1984) Mass Estimates by Computed Tomography: physical density from CT Numbers. AJR Am J Roentqenol 143(5): 1101- 1104.
- Rosenblum LJ, Mauceri R a, Wellenstein DE, Thomas FD, Bassano D a, et al. (1980) Density patterns in the normal lung as determined by computed tomography. Radiology 137(2): 409-416.
- Slutsky RA, Peck WW, Higgins CB, Mancini GB (1984) Pulmonary density distribution in experimental and clinical cardiogenic pulmonary edema evaluated by computed transmission tomography. Am Heart J 108(2): 401-407.
- Storto ML, Kee ST, Golden JA, Webb WR (1995) Hydrostatic pulmonary edema: high-resolution CT findings. AJR Am J Roentgenol 165(4): 817- 820.
- Ribeiro CMC, Marchiori E, Rodrigues R, Gasparetto E, Souza AS, et al. (2006) Hydrostatic pulmonary edema: high-resolution computed tomography aspects. J Bras Pneumol publicaça̋o Of da Soc Bras Pneumol e Tisilogia 32(6): 515-522.
- Zach JA, Newell JD, Schroeder J, Murphy JR, Curran Everett D, et al. (2012) Quantitative computed tomography of the lungs and airways in healthy nonsmoking adults. Invest Radiol 47(10): 596-602.
- Lewin S, Goldberg L, Dec GW (2000) The spectrum of pulmonary abnormalities on computed chest tomographic imaging in patients with advanced heart failure. Am J Cardiol 86(1): 98-100.
- Komiya K, Ishii H, Murakami J, Yamamoto H, Okada F, et al. (2013) Comparison of chest computed tomography features in the acute phase of cardiogenic pulmonary edema and acute respiratory distress syndrome on arrival at the emergency department. J Thorac Imaging 28(5): 322-328.
- Kuzkov VV, Suborov EV, Kirov MY, Waerhaug K, Mortensen R, et al. (2010) Radiographic lung density assessed by computed tomography is associated with extravascular lung water content. Acta Anaesthesiol Scand 54(8): 1018-1026.
- Patroniti N, Bellani G, Maggioni E, Manfio A, Marcora B, Pesenti A (2005) Measurement of pulmonary edema in patients with acute respiratory distress syndrome. Crit Care Med 33(11): 2547-2554.
- Zhang F, Li C, Zhang J, Guo H, Wu D (2014) Comparison of quantitative computed tomography analysis and single-indicator thermodilution to measure pulmonary edema in patients with acute respiratory distress syndrome. Biomed Eng Online 13: 30.
- Vock P, Salzmann C (1986) Comparison of computed tomographic lung density with haemodynamic data of the pulmonary circulation. Clin Radiol 37(5): 459-464.
- Nomura M, Miyagi Y, Tachi K, Sakabe Y, Sakai Y, et al. (1984) Measurement of lung density in congestive heart failure by computed tomography. Jpn Heart J 25(6): 979-992.
- Gevenois PA, Scillia P, Maertelaer V de, Michils A, Vuyst P De, Yernault JC (1996) The effects of age, sex, lung size, and hyperinflation on CT lung densitometry. AJR Am J Roentgenol 167(5): 1169-1173.
- Hoffmann U, Truong QA, Schoenfeld DA, Chou ET, Woodard PK, et al. (2012) Coronary CT Angiography versus Standard Evaluation in Acute Chest Pain. N Engl J Med 367: 299-308.
- Gray AJ, Roobottom C, Smith JE, Goodacre S, Oatey K, et al. (2016) The RAPID-CTCA trial (Rapid Assessment of Potential Ischaemic Heart Disease with CTCA) - a multicentre parallel-group randomised trial to compare early computerised tomography coronary angiography versus standard care in patients presenting with suspected. Trials 17(1): 579.
