 Review Article
Abstract
Rehabilitation cushions are used to prevent prolonged exposure to high pressure points among persons with impaired mobility, diabetics and the elderly. Pressure distribution sensors have been used as indicators of this exposure and they provide reliable information to avoid pressure ulcers and blood flow restrictions that could lead to tissue necrosis. This work describes a prototype model of a multi-chamber cushion system that senses the patient-cushion interface pressure and uses a microcontroller to re-distributes the pressure-profile by an inflation-deflation methodology which continuously preserves an adequate pressure levels for patients with low mobility. The system includes a temperature measurement to activate a simple ventilation system. The pressure sensors provide a good indicator of pressure distribution over the surface to estimate cushion interface parameters such as contact area, high pressure area, high pressure location and pressure position. The prototype model operates using strain pressure sensors in the control loop and uses the capacitive sensor as an indication of pressure profile.
Keywords: Rehabilitation cushions; pressure profile; strain sensors; capacitive sensors; air-based cushions
Introduction
Impaired sensory perception is a risk factor for pressure ulcer development. Pain and discomfort are symptoms of excessive pressure and potential tissue damage. Those who are unable to perceive pain or discomfort are not aware that pressure buildup is a problem and will not take steps to relieve excessive pressure. Fisher et al demonstrated that sensory perception is associated with pressure ulcer development [1]. Early intervention to reduce pressure over bony prominences is of primary importance [2,3]. Therefore, patients with this impaired sensory perception need a pressure detection system in order to supervise and alarm when high pressure levels are sensed [4]. Healthcare professionals use a range of techniques that are designed to prevent pressure ulcers [4-7]. They include regularly changing a person’s position or using equipment, such as specially designed mattresses and cushions, to protect vulnerable parts of the body [5-7]. Air based rehabilitation cushions have been used to prevent and limit the possibility of increasing risk factors in persons with limited mobility [8-10]. Different rehabilitation cushions, most of them air based, intend to provide a feasible practical solution to the prevention and treatment of anti-decubitus ulcer with minimum assistance and optimum cost. Several interesting innovative ideas have been granted patents [11-16] and they use a reference pressure condition with control of inflation and other specific features such as liquid collection, massaging routines, ventilation and pressure relief through valve manifolds.
The idea of a continuous dynamic re-distribution of pressures through the patient-cushion interface was first conceived in [17]. This patent called “Microcontrolled Cushion and Method to Control and Prevent Ulcers” visualizes a multi-chamber air-filled cushion system which its inflation levels are controlled by a microcontroller that continuously monitors the two-dimensional pressure-profile in the cushion-patient interface to allow a demand for a redistribution using an inflation-deflation methodology. Pressure monitoring is a key issue in the development of this dynamic rehabilitation cushion. Research in pressure monitoring for rehabilitation cushions has been performed with promising results. However, so far no commercial products include the dynamic pressure sensor while controlling and redistributing the weight of a patient trough a rehabilitation cushion. Y Yang and J Wang [18] developed an air-alternating anti-decubitus wheelchair seating (AAWS) system, which may help users reposition themselves when sitting and avoid occurrence of pressure ulcers. M Yip et al. [19] proposes a monitoring system using an array of 99 capacitive pressure sensors on a 17-cm x 22-cm sheet which is flexible in two dimensions. R Meffre et al. [20] propose a method for interface pressure measurements using electro-pneumatic pressure sensors integrated into a seat. M Sergio et al. [21] developed a pressure-sensitive fabric and a solution for the array read-out, which features run-time data post-processing.
integration into clothing to measure pressure on human body. MAF Carvalhol et al. [23] and DM Smith [24] proposed a monitoring system of discomfort in disability, bed rest people and surgical patients to provide the people with special needs (PSN) a relief to the level of the sensitive perception of discomfort, assuring greater independence. References [25-28] show the use of data acquisition systems for capacitive sensor interfaces that integrates an analog to digital converter (A/D) in order to obtain the digital code representation of the capacitive measurement of pressure profile distributions. Finally, references [19,29] show pressure monitoring systems that use capacitive-to-digital-converter (CDC) devices in specific applications such as pressure profile determination. This work describes a prototype model for a six air-chamber cushion prototype controlled by a microcontroller which monitors the two dimensional pressure-profile in the cushion-patient interface to determine an inflation-deflation scheme in continuously preserving adequate pressure levels for patients with low mobility. The prototype consists of: six-air filled chambers, mechanical
system to sustain the inflation and deflation methodology, microcontroller and associated hardware, strain sensor and capacitive sensor pressure profile data acquisition systems and temperature sensor data acquisition system.
Air Filled Chambers
The air-filled chamber system consists of a set of six inflatable volumes made of rubber that include an electronically driven valve on the back to provide inflation and deflation actions in order to dynamically modify the pressure distribution at the cushion´s interface. The air chambers model is based upon a conceptual prototype developed by a research group at Tecnológico de Monterrey. Figure 1 shows the conceptual model for the chamber system and Figure 2 illustrates the air chamber system made by rubber and constitute the initial prototype system. Each chamber has dimensions of 14x23cm with a full inflation height of 5 cm.
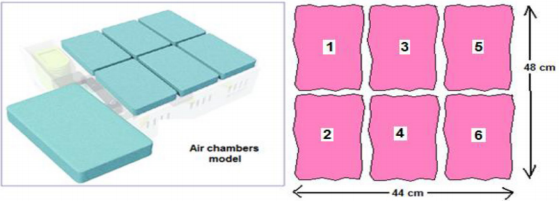
Figure 1: Air chambers model to provide the intelligent inflation-deflation system.
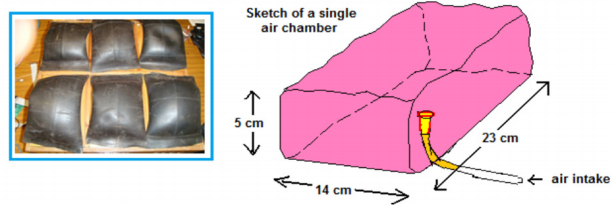
Figure 2: Air chambers in the prototype system.
Mechanical System Model
The mechanical system consists of supporting structure, compressor, manifold, redistribution valves and fans. The compressor provides the push-in air to the chambers via the manifold that distributes pressure to each of the 6 air lines using a star-like scheme. The air inputs from the bottom of the manifold and gets distributed towards a set of six outlets located around the main cylindrical cavity. The star-like manifold with its six air outlets and its location underneath the cushion air chambers delivers air pressure to 6 electro-valves. The electro-valves receive the air from the compressor and open or close under the microprocessor commands. The microcontroller sends a pulse-wave which modulates the air pressure based on an inflation period to regulate the inflation level on the chamber. The Figure 3 shows the electro-valve locations just underneath to regulate the air flow to the air chambers. The electro-valves from Clippard [30] receive air at a pressure between 0 to 105 psig and it is operated with DC voltages between 0 and 12 V. A ventilation system is used to circulate air through the interface for allowing a sort of soft temperature regulation and environmental refresh beneath the air chambers. The fans are controlled under microcontroller demand based upon two measurements of temperature in different locations beneath the air chambers.
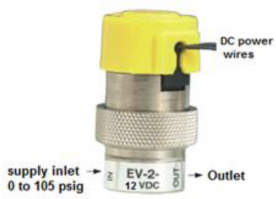
Figure 3: Electro-valves control air flow to the chambers under microcontroller demand. Courtesy of Clippard [30].
Microcontroller and Associated Hardware
The microcontroller boards include two ATMELMega8 microcontrollers [31] to perform essentially two important tasks: a. pressure profile monitoring and control; and b. temperature data acquisition and air ventilation control. Figures 4-7 show the sensor signal conditioning, power supply/electronic driver circuits, the microcontroller pressure control loop and the ventilation microcontroller loop, respectively. In the pressure control loop the microcontroller demands actions (Figure 6) to open or close the electro-valves (EV1 to EV6) using the device driving transistors. The same loop displays control mode, automatic and error indication signals. In the ventilation control loop the microcontroller demands actions (Figure 7) to activate fans (fan1 to fan6) using the device driving transistors. The same loop displays high temperature indication signals and temperature status through the LCD device. The software routines and algorithm to monitor and control the pressure points are discussed in the software section of this article. Also, the temperature data acquisition and air ventilation routines are discussed further in the system integration and software section.
Figure 3: Electro-valves control air flow to the chambers under microcontroller demand. Courtesy of Clippard [30].
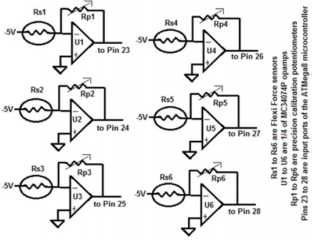
Figure 4: Strain sensor signal conditioning circuits.
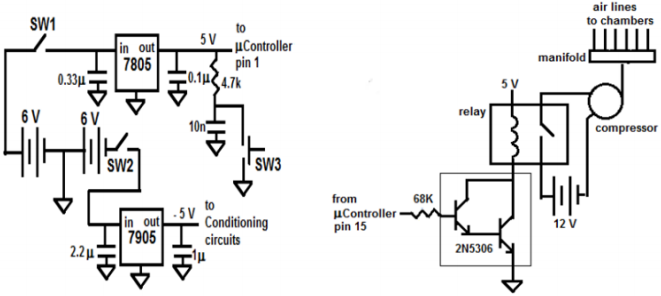
Figure 5: Power supply and electronic driver circuits: a. Microcontroller and signal conditioning circuits power supply; b. Electronic driver for compressor to provide air to chambers.
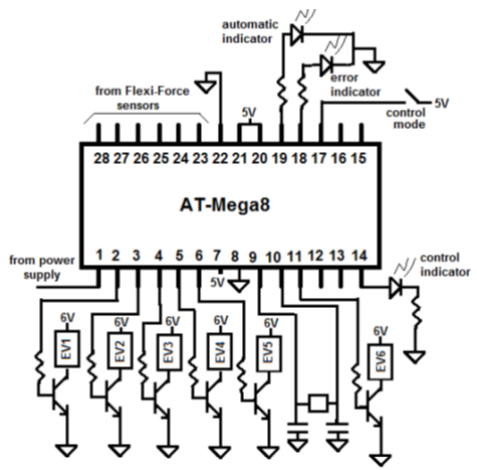
Figure 6: Microcontroller pressure control loop. Strain sensors provide one way to measure point pressures at the interface. Electro-valves (EV´s) provide the inflation/deflation demand at the air chambers.
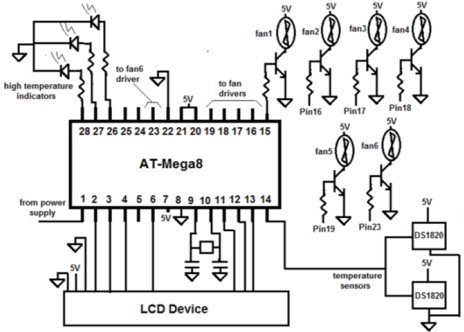
Figure 7: Ventilation microcontroller and associated hardware. Integrated temperature sensors, DS1820, and electronic drivers for ventilation control.
Strain Sensor Pressure Data Acquisition
The strain sensor system consists of 6 Flexi-Force pressure sensors from Tekscan [32] that provide the indication of the point pressure at the six air chambers to form the two dimensional pressure-profile data. The resistive sensors are conditioned using inverting amplifiers which are calibrated to obtain maximum sensitivity at the output of six operational amplifiers. The output voltages are monitored by the microcontroller to verify the pressure levels at each of the chamber location. The Figure 4 illustrates the strain sensor signal conditioning and the Figure 6 illustrates where the microcontroller receives those signals.
Temperature Sensor Data Acquisition
Temperature is measured by the DS1820 integrated sensor [33] at two locations over the cushion chamber interface as illustrated in Figure 7. This device provides a 16-bit digital code corresponding to the measured temperature at the interface. Once the measurement is performed the code is sent directly to the microcontroller to perform some processing and determine if the threshold temperature is being surpassed. There are two threshold temperatures (28°C and 32°C) that turn on four and then the six fans to provide ventilation to the cushion interface.
Capacitive Sensor Pressure Profile Data Acquisition
A parallel plate capacitor provides a good sensitivity to applied pressure while having a relatively large linear behavior. The linearity and sensitivity characteristics are required to provide a proportional behavior of capacitance and applied force. The Figure 8 shows the model of the parallel plate capacitor when pressure is applied. In this case the dielectric thickness decreases, and the capacitance increases. The applied pressure reduces the separation distance of the parallel plate and therefore it is inversely proportional to capacitance [19].
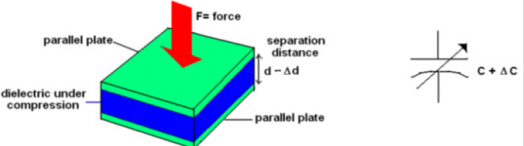
Figure 8: Parallel plate capacitor model with variable capacitance.
The dielectric thickness can be modeled as an elastic material using the spring equation as follows:
Where d is the plate of separation, k is the spring constant of the dielectric and F is the applied force. Assuming that the electrodes
are rigid and the cross-section area stays constant, the fractional capacitance is:
Expressing the force in terms of pressure and:
Finally a relationship between pressure (P) and the fractional change in capacitance C/C is derived as follows [19]:
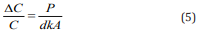
Equation (5) shows that the fractional change in capacitance is directly proportional (but in the opposite direction) to the change in pressure and inversely proportional to separation distance and cross sectional area. Biomedical instruments use mmHg to express blood pressure. Pressures above 32 mm Hg occludes blood flow into the capillary [19]. Therefore, the pressure range applied to this type of capacitor sensor range from 0 to 32 mmHg. For the capacitive sensor array two prototype dielectric materials were considered: Styrene-Butadiene-Rubber (SBR) and synthetic leather with Nylon (SLN). The array configurations are shown in Figure 9. A sheet of SBR (46 cm x 41 cm) and 2 mm thick with the electrodes of 1.6 cm diameter are used to create an 8x10 array. Then a conductive copper tape is used to connect rows of electrodes. This procedure is repeated in the other side of the dielectric sheet with the electrodes aligned. Also a sheet of SLN (40 cm x 40 cm) and 1.2 mm thick with electrodes of 1.1 cm diameter are placed on top of the dielectric material forming an array of 8 x 10 elements. In both cases a conductive copper tape connects the electrodes in columns, generating 80 capacitors arranged in a matrix fashion. The capacitance is generated in the overlap area of the copper tape and the circular electrode, as shown in the Figure 9. The Figure 10 shows pictures of both prototypes, using the SBR and the SLN dielectric materials. The two capacitive sensor configurations selected were tested with the capacitance meter. The objective was to determine typical capacitance values at each array element.
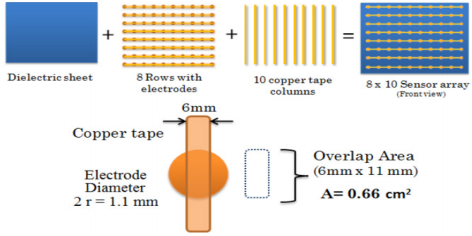
Figure 9: SBR and SLN Sensor array assembly configurations.
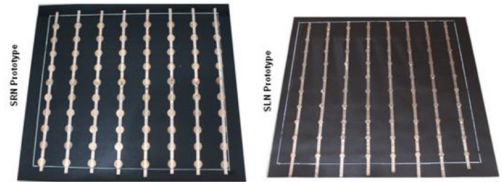
Figure 10: SBR and SLN capacitive sensor array prototypes.
Comparing both, the SBR and SLN sensor arrays shows average capacitance measurements for of 49.05 pF and 34.6 pF, respectively. Average maximum and minimum values for SBR are 49.7 pF and 48.3 pF, respectively. Average maximum and minimum values for SLN are 36.01 pF and 31.96 pF, respectively. Since the SLN presents a lower capacitance values that requires lower compensation in the electronic data acquisition system, this sensor array is considered the best option. To perform the data acquisition system a Capacitance to Digital Conversion (CDC) device is used. The CDC converts the measured capacitance into an electric signal and then into a digital code which can be transmitted to a microcontroller or a PC. The initial test of the pressure monitoring system consists of examining the initial capacitance value of the 80 elements at zero pressure and verifying that the initial values remain constant. Figures 11-16 show the test results for different pressure profiles to determine contact area, high pressure area and high-pressure locations. The profiles illustrate the capacitance value at each point and the horizontal or vertical top five projection (TFP) calculations [10] for either rows (Y axis) or columns (X axis), respectively, are used as indicators of pressure distributions. This parameter, for the ith row or column, is calculated as follows:
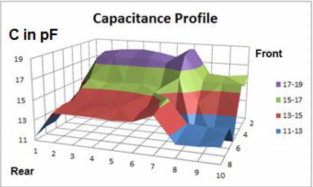
Figure 11: Capacitance profiles showing high pressure over the low border and a slight loading over the right side. Sensor areas A=0.66 cm2.
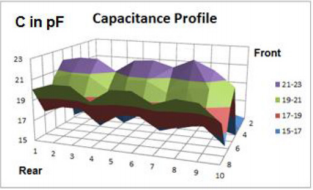
Figure 12: Capacitance profiles showing high pressure over the upper half interface and a slight loading in the middle. Sensor areas A=0.66 cm2.
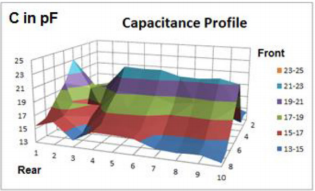
Figure 13: Capacitance profiles showing middle pressure distribution with slight emphasis to the lower side. Sensor areas A=0.66 cm2.
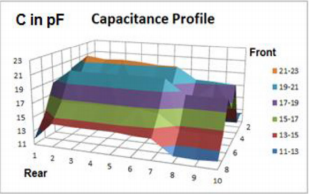
Figure 14: Capacitance profiles showing middle pressure distribution with slight emphasis to the upper side. Sensor areas A=0.66 cm2.
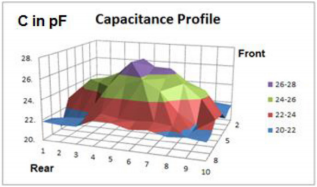
Figure 15: Capacitance profiles showing a pressure distribution close to the center with slight emphasis to the lower left side. Sensor areas A=0.44 cm2.
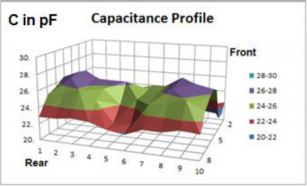
Figure 16: Profiles showing a balanced upper middle pressure distribution with slight emphasis to the left. Sensor areas A=0.44 cm2.

Where C(i,1) …C(i,5) are the largest capacitance values sensed for the particular row or column i. Also the nomenclature for providing contact and high pressure areas is [x1, x2…xn; y1,y2…ym]; where n and m may go from 1 to 10 and from 1 to 8, respectively. The profile from the Figure 11 shows an example of a low border position with a slight balance over the right side of the mat. The profile from Figure 12 shows an example of a distribution over the upper half interface with a slight balance loading over the middle of the mat. The profile from the Figure 13 shows an example of a middle pressure distribution with a slight balance loading over the lower side. The profile from Figure 14 shows even another example of a middle pressure distribution with a slight balance loading over the upper side. The Figures 15 & 16 show another set of pressure profiles using a beta prototype where the equivalent capacitive sensor area is now 0.44 cm2 . The profile from the Figure 13 illustrates a typical example of a close to the center pressuredistribution with a slight loading over the lower left side. The profile from Figure 16 shows a typical middle balanced pressure distribution with a slight loading to the upper left side. Figures 11- 16 also show calculations of contact and high-pressure areas. Table 1 illustrates a comparison between the 6 profile cases described by Figures 11-16, in terms of the three parameters: contact area, high pressure area and pressure position. From Table 1 we observe that figures 15 and 16 illustrate the highest concentration of pressure points over a small surface area leading to the highest resolution obtained by profile from Figure 16 or upper-middle.
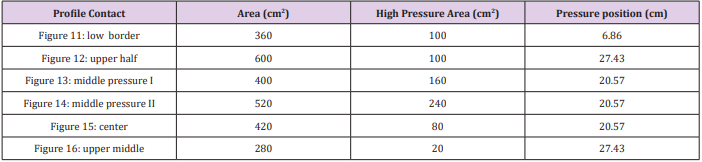
Table 1: Summary of 6 profile cases analyzed with the capacitive pressure sensor array device.
The Figure 14 illustrates the maximum distributed profile thru the sensor surface with 240 cm2 of maximum pressure area. This corresponds to the middle pressure profile II which is also the second largest contact area of the tested profiles. Figure 12 which illustrates the upper half pressure concentration gets the maximum contact area of all 6 profile configurations. Finally, the pressure position characteristic produces from 20 to 21 cm for the middle and center profiles (Figures 13-15) and roughly 27 cm for the upper-half and upper-middle distributions (Figures 12 & 16). The lower border profile shows just 6.86 cm pressure position. The capacitive sensor array is being incorporated to the micro-controlled cushion as an indicator device to examine the pressure profile generated by the dynamic control loop. It indicates the high-pressure areas at the patient-cushion interface. The Flexi Force piezo-resistive pressure sensors are used in the control loop to feedback the high-pressure positions to the microcontroller in order to demand the inflation/deflation corrective actions to sustain an adequate pressure profile in the interface. Therefore, up to this point both sensor systems operate independently, and they provide a different kind of information.
Prototype Model Integration and Software
The prototype system was integrated and a software system performs the monitoring of pressure, control of air chambers, monitoring of temperature and ventilation activation using the hardware systems described in previous sections. Figure 17 shows the prototype integrated system as tested. The pressure control works in two different modes: automatic and pressure monitoring. The automatic mode uses the following software procedure in a sequential fashion.
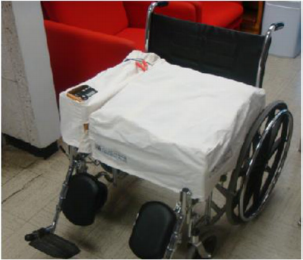
Figure 17: Micro cushion prototype tested.
a. Initialization of parameters and compressor activation
b. Inflate chambers 1 and 3.
c. Inflate chambers 2 and 4.
d. Inflate chambers 5 and 6.
e. Repeat the sequence.
This procedure was programmed just to demonstrate the principle of sequencing of inflation to provide an automatic predetermined routine that can be suggested by medical personal to the patient. The pressure monitoring mode uses the 6 strain pressure sensors and uses the following software procedure:
a) Initialization of parameters, compressor activation and general inflation of chambers.
b) Turn-off the compressor
c) Verify the pressure condition at each pressure sensor
d) If none of the sensors are pressed beyond certain threshold limit go to step 3. If one of the sensors is pressed beyond the threshold go to step 5.
e) Open all the electro-valves to inflate and turn-on the compressor.
f) Turn-off the compressor and close all the electro-valves except the one that was detected over-pressed beyond the threshold limit.
g) Close the over-pressed electro-valve and retun to step 3.
The code includes counters to determine long-inflation and short-inflation periods which are activated depending upon the number of times a sensor has been activated. Again, this routine has been developed in order to maintain a very homogeneous pressure profile over the cushion. Other procedures can be implemented to obtain different objective functions as required by the medical recommendations. Moreover, the higher resolution (8x10 points) capacitive profile sensor described in previous sections can be incorporated into the system for providing a better pressure monitoring system and the inflation-deflation routines could be changed by modifying the software program. The implemented temperature control program is simple. The system acquires the temperature measurements from the two temperature sensors and compares to temperature thresholds defined previously (28°C and 32°C). If the temperature surpasses the first threshold, then the system turns on 4 fans. If the system surpasses the second threshold the system turns on the other 2 fans. After the system returns to temperatures below 28°C then the system re-establishes their initial conditions by turning off all fans. This routine was very simple and other more sophisticated temperature and environmental controls could be developed upon request from the medical staff.
Comparison to Other Air Based Cushion Experimental Technologies
Table 2 shows a comparison between similar experimental technologies which have used air-based cushions to perform either pressure control or ventilation. Column 1 corresponds to a “Ventilated access interface and cushion support system” [15], column 2 corresponds to a “Controllable inflatable cushion” [16] and column 3 corresponds to a “Microcontrolled cushion and method to prevent ulcers” [17]. This last column is the technology described in this article. Even though the actual prototype of the microcontrolled cushion is at an experimental stage, additional efforts are developed to perform some enhancements and cost reductions to generate an optimal prototype for manufacturing. Some of these enhancements are manifold distribution, electrovalves, batteries, power supply and sensor capacities.
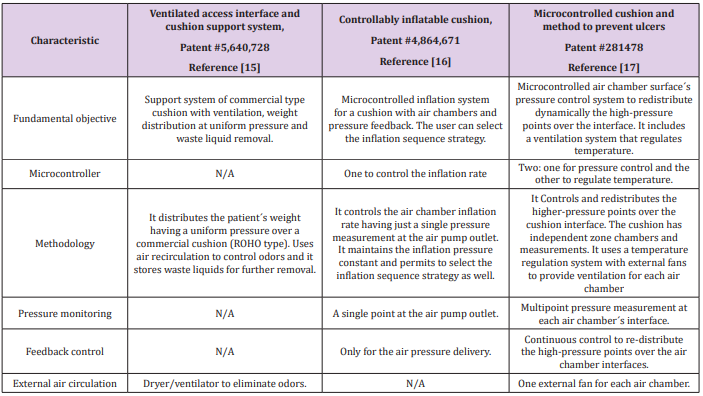
Table 2: Comparison table of similar experimental technologies.
Conclusion
This paper presented a prototype model of a dynamic rehabilitation air-based cushion system to distribute pressure profiles in patients with low mobility. The system includes a pressure and temperature monitoring, pressure profile control through inflation and deflation of 6 air chambers, ventilation control through the activation of 6 fans underneath the cushion and two modes of operation under software control (automatic and pressure monitoring). The pressure monitoring describes two methods: using 6 strain pressure transducers and using an 8x10 capacitive sensor array which provides a better resolution. The integration test software used only the 6-strain pressure sensor system. To design the capacitive array several materials were considered, however only the synthetic leather with Nylon (SLN) was finally selected because they generated the best possible linear behavior range with their associated sensitivity to applied forces. The capacitive array consisted upon 8x10 copper circle electrodes connected by a conductive strip by rows in the top side and strip electrode rows in the other side. The pressure profile testing using the capacitive sensor array shows the expected profiles to obtain pressure distributions over the interface of the rehabilitation cushion calculating particular parameters such as contact area, high pressure area, and high-pressure locations. The capacitive array sensor model is used just to provide the pressure profile information. Finally, current work is performed to improve the performance of the dynamic rehabilitation cushion system for a real time monitoring and control of pressure profiles to prevent ulcers.
References
- Fisher AR, Wells G, Harrison MB (2004) Factors associated with pressure ulcers in adults in acute care hospitals. Holistic Nursing Practice 18: 242-253.
- D Krasner (1990) Pressure ulcers: An overview, Chronic wound care. PA: Health Management Publications.
- M Reddy, SS Gill, PA Rochon (2006) Preventing pressure ulcers: a systematic review. Journal of American Medical Association 296(8): 974-984.
- Conine TA, Hershler C, Daechsel D, Peel C, Pearson A (1994) Pressure ulcer prophylaxis in elderly patients using polyurethane foam or Jay wheelchair cushions. Int J Rehabilitation Research 17(2): 123-137.
- (2009) European Pressure Ulcer Advisory Panel and National Pressure Ulcer Advisory Panel. Prevention and treatment of pressure ulcers: quick reference guide. National Pressure Ulcer Advisory Panel, Washington DC, USA.
- H Miller, J Delozier (1994) Cost implications of the pressure ulcer treatment guideline. Columbia Md Center for Health Policy Studies, Technical Report.
- AH Sacks (1989) Can pressure sores be prevented? Engineering in Medicine and Biology Society, Proceedings of the Annual International Conference of the IEEE Engineering in Medicine and Biology 5: 1479- 1480.
- E Park Lee, C Caffrey (2004) Pressure ulcers among nursing home residents: United State, National Center for Health Statistics NCHS data brief (14): 1-8.
- Y Tanimoto, H Takechi, H Nagahata, H Yamamoto (1998) The Study of Pressure Distribution in Sitting Position on Cushions for Patient with SCI (Spinal Cord Injury). IEEE Transactions on Instrumentation and Measurement 47(5): 1239-1243.
- Y Tanimoto, H Takechi, H Nagahata, H Yamamoto (2000) High Pressure measurement of air cushions for SCI patients. IEEE Transactions on Rehabilitation Engineering 49(3): 666-670.
- DN Hampton, WC Shaw (2004) US patent 20040226102. Alternating Pressure Cushion.
- M Shaw (2005) US patent 20050060808. Antidecubitus Heel Pad
- WF Graebe Jr (2004) US patent 20040083550. Air Cushion Control System
- MC Shah, AA Ezra (2003) US patent 6557937. Pressure Relieving Wheelchair Seating Apparatus.
- R Graebe (2008) US patent 5640728. Ventilated Access Interface and Cushion Support System
- D Evans (2006) US patent 4864671. Controllably Inflatable Cushion.
- MA Lemiszka, MI Reyes De La Cruz, G Dieck Assad, SO Martínez Chapa (2010) IMPI Mexican patent 281478.
- Y Yang, J Wang (2009) Design of an air-alternating anti-decubitus wheelchair seating system, Proceedings of the Biomedical Circuits and Systems Conference. BioCAS-IEEE, pp. 261-264.
- M Yip, DD He, E Winokur, AG Balderrama, R Sheridan, H Ma (2009) A Flexible Pressure Monitoring System for Pressure Ulcer Prevention. 31st Annual International Conference of the IEEE EMBS, pp. 1212-1215.
- R Meffre, C Gehin, A Dittmar (2007) MAPI: Active Interface Pressure Sensor Integrated into a Seat. Proceedings of the 29th Annual Internacional Conference of the IEEE EMBS, pp. 1358-1361.
- M Sergio, N Manaresi, M Tartagni, R Guerrieri, J Canegallo (2002) A textile based capacitive pressure sensor. Proceedings of IEEE 2: 1625- 1630.
- J Meyer, P Lukowicz, G Troster (2006) Textile Pressure Sensor for Muscle Activity and Motion Detection. Proceedings of the Wearable Computers IEEE International Symposium, pp. 69-72.
- MAF Carvalho, JG Rocha, FM Duarte, JA Santos (2007) Monitoring system of discomfort in disability, bed rest people and surgical patients. Proceedings of the Industrial Electronics ISIE-IEEE International Symposium, pp. 2758-2762.
- DM Smith (1995) Pressure Ulcers in the Nursing Home. Ann Intern Med 123(6): 433-442.
- SM Huang, AL Stott, RG Green, MS Beck (1988) Electronic Transducers for industrial measurement of low value capacitances. J Physics E: Science Instrumentation 21(3): 242-250.
- H Matsumoto, H Shimizu, K Watenabe (1987) Switched capacitor charge balancing analog-to-digital converter and its application to capacitance measurement. IEEE Trans. on Instrumentation and Measurement 36(4): 873-877.
- DM Brienza, PE Karg, CE Brubaker (1996) Seat Cushion Design for Elderly Wheelchair Users Based on Minimization of Soft Tissue Deformation Using Stiffness and Pressure Measurements. IEEE Transactions On Rehabilitation Engineering 4(4): 320-327.
- R Nojdelovt, N Nihtianov, E Van Doren (2007) Capacitance to Digital Converter. Proceedings of the IEEE Sensors Applications Symposium, San Diego, California, USA, p. 1-5.
- J Meyer (2006) Textile Pressure Sensor for Muscle Activity and Motion Detection. Proceedings of the 10th IEEE International Simposium on wearable computers, p. 69-72.
- Clippard Minimatic Catalog, The Mouse Valve Series, EV, ET, EC Series, Clippard Instrument Laboratory Inc., 2010.
- (2008) ATMEL Inc, ATMega8 microcontroller.
- EM Landis (1930) Micro-injection studies of capillary blood pressure in human skin. Heart 15: 209-228.
