 Research Article
Abstract
Positioning the glenoid implant correctly in reverse total shoulder arthroplasty is critical for long term prosthetic survival and clinical success. Patient specific instrumentation and computer navigation can aid glenoid positioning; however, their efficacy needs to be investigated using reliable techniques. This study describes a novel 3-D computer tomography technique to evaluate glenoid implant position following RTSA with a high level of spatial resolution and measures the reliability of this technique in a cohort of patients.
Methods: CT scans were converted to 3-D models, from which the inclination and version of the glenoid component were measured on two occasions using proprietary software.
Results: Postoperative achieved glenoid implant inclination and version measurements were available for twenty three cases. Measurements for both inclination and version were consistent between the two occasions. ICC scores were excellent, with 0.987 for inclination and 0.933 for version.
Conclusion: This study describes a novel 3-D evaluation of glenoid implant position in RTSA, which has clinical utility and is highly reproducible.
Keywords: Glenoid Inclination; Glenoid Version; Reverse Shoulder Arthroplasty; 3D Model; CT; Reliability
Abbreviations: RTSA: Reverse Total Shoulder Arthroplasty; PSI: Patient Specific Instrumentation; CT: Computer Tomography; PACS: Picture Archiving and Communication System; AOI: Areas of Interest; STL: Sterolithography; ICC: Intraclass Correlation Coefficient; HU: Hounsfield-Unit
Introduction
Reverse total shoulder arthroplasty (RTSA) is being performed more frequently and indications for surgery have expanded to now include osteoarthritis with severe glenoid bone deformity and glenoid bone deficiency from previous failed arthroplasty surgery. Positioning the glenoid implant correctly is critical for long term prosthetic survival and clinical success [1]. Patient specific instrumentation (PSI) and computer navigation are surgical aids to positioning the glenoid implant in specific version and inclination as directed by the preoperative plan. However, the efficacy of PSI and computer navigation techniques require reliable techniques to measure postoperative glenoid implant position. Radiographic imaging can be used, but sequential radiography requires standardised patient positioning, and bony overlap on a 2-D image can hamper assessments [2]. Conventional 2-D computer tomography (CT) scan may still have limitations due to metal artefact from the implant and may be inaccurate especially in measuring glenoid version [3,4]. However, with new techniques in acquisition, reconstruction and processing, glenoid implant position following RTSA can be evaluated in 3-dimensions without implant artefact or bony overlay. This study describes a novel 3-D CT measurement technique to evaluate glenoid implant position following RTSA with a high level of spatial resolution and measures the reliability of this technique in a cohort of patients.
Materials and Methods
Study Cohort
Twenty-four consecutive patients undergoing reverse total shoulder arthroplasty using the Equinoxe® Reverse System were recruited to the study. Surgery was performed by a single consultant orthopaedic surgeon. Approval to conduct the study was obtained from the institutional Human Research Ethics Committee (approval number 1221). Each patient underwent a pre-operative planning CT scan on a Toshiba Aquilion ONE™ (Canon Medical Systems Corporation, Ōtawara, Tochigi, Japan) using the BluOrtho® (Blue Ortho SAS, La Tronche, France) CT protocol, a helical CT, slice thickness of 0.5mm, and pixel resolution of 0.492x0.492mm. Glenoid baseplate position was planned using the ExactechGPS® Shoulder Application (Exactech Inc, Gainseville, Florida, USA). Anatomical landmarks (glenoid centre, trigonum, and inferior angle) were used to define the scapula plane, with the scapula axis along the vector between the glenoid centre and trigonum [5]. The preoperative plan specified a target version and inclination of the implanted glenoid baseplate to be achieved at surgery. At surgery, the ExactechGPS® navigation system was used to provide realtime feedback to position the glenoid implant according to the pre-operative plan. A post-operative CT scan was obtained at three months, using the same protocol as the pre-operative scans.
Scapula and Implant Modelling
Pre- and post-operative CT series were exported from the Picture Archiving and Communication System (PACS) as DICOM images and imported into the medical imaging processing software Mimics (v21.0, Materialise NV, Leuven, Belgium). Areas of interest (AOI) were defined as the scapula only in the pre-operative scans, and scapula with implant and implant only for the post-operative scans. Masks for each AOI were generated using Hounsfield-unit (HU) thresholds for either bone (≥225 HU) or metallic prostheses (≥2200 HU). AOIs were segmented using a combination of the inbuilt Split Mask and 2D mask editing tools to erase the extraneous mask surrounding the AOI. A Region Grow operation isolated the AOI from any disconnected pieces of mask. Three-dimensional models of each AOI were calculated from the masks at Optimal quality. Models were then exported in sterolithography (STL) format.
Glenoid Component Version and Inclination
The anatomical site of the neoplasm in PLAG1 transgenic mouse was within the unilateral submandibular gland, completely encapsulated, with multiple-nodules accumulation and clear border with the adjunct normal tissue. Meanwhile, cystic degeneration was scattered in well-demarcated area of PA components. The photomacrograph disclosed the tumor with several tumor bosselations (Figure 1A & 1B). Some bosselations projected far beyond the range of normal salivary glands, but normally within a complete capsule. Like PA in human salivary glands, PA in PLAG1 transgenic mouse may grow beyond the pseudo-encapsulation, and this feature may not be regarded as invasion (Figure 1C & 1D). The tumor is pathologically characterized by bland myoepithelial cells in mesenchymal component arranged in short fascicles admixed with tubule-glandular structure (Figure 2A).
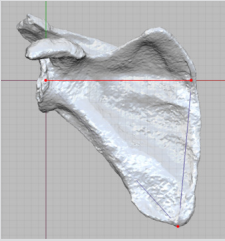
Figure 1: Anatomical landmarks (red points) defining the scapula axis (red line) and scapula plane (grid), shown on the pre-operative planning model.
STLs of the pre- and post-operative models were imported into Freeform Plus (v2018, Geomagic, North Carolina, USA) for measurement. The scapula plane was created using the 3 anatomical landmarks described in the pre-operative planning (Figure 1). A plane normal to the scapula plane, analogous to the axial plane, was created by rotating the scapula plane 90 degrees about the scapula axis. For each patient, post-operative scapulae were aligned manually and registered to the pre-operative scapulae. The subsequent transformation matrix was used to translate the implant only models to the pre-operative coordinate system. The implant axis was determined by registration of a CAD model of the peg to the post-operative implant model (Figure 2). The scapula and implant axes were projected to the scapula and normal planes and converted to curves. Angles were measured using the in-built angular measurement tool, which snaps to the end-points and intersections of the curves. Inclination was defined as the angular distance between the scapula axis and implant axis in the scapula plane, while version was defined as the angle between the two axes on the normal plane (Figures 3 & 4). The glenoid component measurement of version and inclination were performed on two separate occasions by one observer (AH).
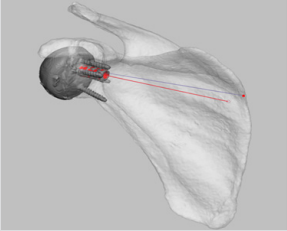
Figure 2: The implant axis (red line) was calculated by registration of a CAD model (red) to the postoperative implant model.
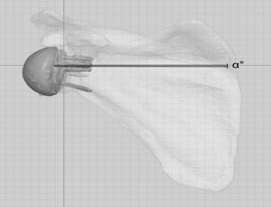
Figure 3: Inclination angle (α) was calculated as the difference between the implant axis and scapula axis on the scapula plane.
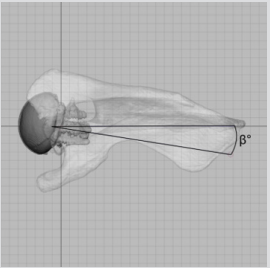
Figure 4: Version angle (β) was calculated as the difference between the implant axis and scapula axis on the plane normal to the scapula plane, analogous to the axial plane.
Statistical Methods
Postoperative achieved glenoid implant inclination and version measurements were investigated between the two measurement occasions to determine method reliability. Intraclass Correlation Coefficient (ICC) were calculated from the one way random effects model. The standard error of measurement (SEM=SD*√(1-ICC)) is also presented. Data analysis was performed using IBM SPSS Statistics v24 (IBM Corp, Australia), and p<0.05 was considered statistically significant.
The Diagnostic Utility of PLAG1 in Atypical Pleomorphic Adenoma
PLAG1, the genetic marker of PA, is positive in lumen-forming cells, tubule-glandular outer layer myoepithelium and stromal spindle cells (Figure 3A). The cytoplasm in most lumen-forming cells showed mild positivity for cytokeratin 7/19 (Figure 3B & 3C), which verified their nature of granular differentiation. Nucleus of both stromal spindle cells and ductal outer myoepithelium showed strong positivity for p63 (Figure 3D) confirming their squamous or myoepithelial differentiation. Moderate SMA positivity was present mainly in the cytoplasm of ductal outer cells (Figure 3E). Furthermore, there is a strong positivity of S100 and Calponin in the cytoplasm of both stroma spindle cells and ductal outer myoepithelium (Figure 3F & 3G). The Ki67 proliferation index counts were around 10 to 12% depending on the field examined (Figure 3H). The morphological patterns together with above immunohistochemical results manifested the diagnostic importance of PLAG1 in atypical pleomorphic adenoma. With a wide morphological spectrum, including cellularity and matrix formation, PA can recapitulate low-grade poly-morphologic tumors of differentiated variants.
Results
Navigation using the ExactechGPS® system was abandoned in the second case. Twenty three cases were therefore available for analysis. Processing took approximately 15 minutes per case. An interval of 122 days separated measurement Day 1 and Day 2. Measurements for both inclination and version were consistent between the two occasions. ICC scores were excellent, with 0.987 for inclination and 0.933 for version (Table 1). SEM values were 0.577 and 1.333 respectively for inclination and version. This means that this protocol has a measurement error of 0.577° for inclination and 1.333° for version. Three cases (3/23, 13.0%) were recorded as having a difference in inclination of >1° between measurement days, with the largest being 3.06°; while 5 cases (5/23, 21.7%) were recorded as having a difference of >1° for version, with the largest being 7.71°.
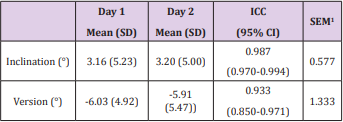
Table 1: Intraobserver reliability of glenoid component inclination and version (n=23).
Note: 1Standard error of measurement.
Discussion
Evaluation of patient outcomes following RTSA includes clinical function and radiologic assessment of implant placement and fixation. Positioning the glenoid implant correctly is critical to prevent implant loosening and poor clinical outcome [6-8]. In this paper, a 3-D CT measurement technique is described using proprietary software for image reconstruction and processing that enables high spatial resolution in the measurement of glenoid implant position. This technique is quick to apply, taking approximately 15 minutes per case, and is highly reliable with ICC of 0.99 for inclination and 0.93 for version when repeated measurement is performed by a trained assessor. As surgical complexity in arthroplasty increases, developments in patient specific instrumentation, robotics and computer assisted surgical technology will continue. The efficacy of these technologies requires equally sophisticated evaluation tools. This study describes a novel 3-D evaluation of glenoid implant position in RTSA, which has clinical utility and is highly reproducible.
References
- Farron A, Terrier A, Buchler P (2006) Risks of loosening of a prosthetic glenoid implanted in retroversion. J Shoulder Elbow Surg 15(4): 521- 526.
- Nyffeler RW, Jost B, Pfirrmann CW, Gerber C (2003) Measurement of glenoid version: conventional radiographs versus computed tomography scans. J Shoulder Elbow Surg 12(5): 493-496.
- Bokor DJ, O Sullivan MD, Hazan GJ (1999) Variability of measurement of glenoid version on computed tomography scan. J Shoulder Elbow Surg 8(6): 595-598.
- Budge MD, Lewis GS, Schaefer E, Coquia S, Flemming DJ, et al. (2011) Comparison of standard two-dimensional and three-dimensional corrected glenoid version measurements. J Shoulder Elbow Surg 20(4): 577-583.
- Friedman RJ, Hawthorne KB, Genez BM (1992) The use of computerized tomography in the measurement of glenoid version. The Journal of Bone & Joint Surgery 74(7): 1032-1037.
- Gutierrez S, Comiskey CAt, Luo ZP, Pupello DR, Frankle MA (2008) Range of impingement-free abduction and adduction deficit after reverse shoulder arthroplasty. Hierarchy of surgical and implant-design-related factors. J Bone Joint Surg Am 90(12): 2606-2615.
- Levigne C, Boileau P, Favard L, Garaud P, Mole D, et al. (2008) Scapular notching in reverse shoulder arthroplasty. J Shoulder Elbow Surg 17(6): 925-935.
- Nyffeler RW, Sheikh R, Atkinson TS, Jacob HA, Favre P, et al. (2006) Effects of glenoid component version on humeral head displacement and joint reaction forces: an experimental study. J Shoulder Elbow Surg 15(5): 625-629.
