 Short Communication
ABSTRACT
A 96-well, high throughput, colorimetric chemical detection method based on 2,4-dinitrophenyl hydrazine (DNPH) reaction of the keto-acid to determine the concentration of pyruvate in human sweat samples is presented. This method represents a miniaturization and optimization of the approach developed by Schwimmer and Weston [1] and modified by Sharma and Lee [2] for assessment of pyruvate in food. Parameters were optimized to accommodate small sample sizes and reagent volumes enabling analyte detection in a simple spectrophotometer-96-well-based detection format.
Keywords: Pyruvate, Keto-Acids, Organic acids, Sweat, Supplementation, Redox state, High throughput, Chemical detection, Colorimetric detection
Abbreviations: DNPH: Dinitrophenyl Hydrazine; HPLC: High Performance Liquid Chromatography; CE: Capillary Electrophoresis
Introduction
Pyruvate is a commonly occurring organic keto-acid found in various food-associated items and many biological fluids. In particular, pyruvate is responsible for imparting distinct flavor attributes to food and is recognized for its association with pungency in onions and garlic, and the enhanced flavor profiles in common fruits [2-5]. Interestingly, pyruvate quantification in onions is of central importance for the selection of breeding stock that imparts lower pungency and enhanced sweetness, which correlate to consumer preference [6-8]. The determination of pyruvate concentration is also of central importance in diagnostics and represents a useful and easily quantified biomarker present in various human biological fluids (sweat, saliva, and urine), or cell culture supernatants. For example, it has been used in conjunction with lactate levels to infer cellular redox state in vitro and in vivo, it has been evaluated in saliva as a quantitative biomarker for head and neck cancers and thus simplifies patient monitoring for individuals at risk [9].
Pyruvate levels have also been used to identify mitochondrial metabolism impediments as reflected by an altered pyruvate to lactate ratio [10,11]. Concordantly, pyruvate levels in blood are modulated by exercise, generally increasing during exertion and decreasing post-recovery [12]. Modulation of pyruvate in other body fluids, particularly sweat, has not been addressed or considered as reflecting intracellular or blood metabolite levels. Pyruvate ingestion influences blood lactate parameters during and post-exercise [13,14, and reviewed 15]. Johnson and Edwards [13] further demonstrated that urine exhibited a similar profile of lactate and pyruvate increase during exercise, both of which then remained elevated 90 minutes post-recovery [13], although sweat or other bodily fluid levels were not considered in this study. As such, various enzymatic, analytical, and chemical methods have been used to quantify the abundance and distribution of pyruvate [6,16]. High performance liquid chromatography (HPLC) and capillary electrophoresis (CE), represent gold standard techniques for the separation, detection, and quantification of this molecule [5,17,18].
Although reliable, HPLC instrumentation may be of limited availability in certain research or educational settings. In addition, such specialized instrumentation is expensive to acquire, run, and maintain. Fluorescence methods are also prevalent and offer analyte sensitivity. Fluorescence methods often couple the reaction of pyruvate to the formation of lactate in the presence of lactate dehydrogenase and fluorometrically follow the change of NADH+H to NAD+ according to the following reaction:
Again, this is a sensitive and specific reaction, but it requires a fluorimeter and expensive enzymes to drive the reaction. To address the shortcomings of the methods described above, a reliable and sensitive assay utilizing chemical detection to determine pyruvate levels in sweat, a readily available biological fluid, was initially proposed by Maclean [16] and subsequently modified by Schwimmer and Weston [1]. This assay was further optimized in terms of sample and reagent volumes and implemented to follow the changes in pyruvate concentrations in sweat samples derived from a group of athletes consuming a Health Canada approved onmarket health supplement that contains pyruvate. This enabled the rapid and sensitive detection of pyruvate level modulation in sweat with simple high throughput spectrophotometric detection of the colored product and may be suitable for use with other biological fluids or matrices.
Procedures
Sweat Collection
Informed consent was obtained from each athlete following Regulatory Ethics Board approval which included the consumption of a Health Canada approved on-market nutritional supplement (NPN80070757) containing a pyruvate as described by Badulescu, et al. [15]. Sweat pyruvate concentrations were determined chemically according to Sharma, et al. [4], which is a modification of the method proposed by MacLean [17]. This chemical approach was further modified to accommodate a sweat sample matrix obtained from athletes following a prescribed exercise protocol as described in Figure 1. Both the sample and reagent volumes were miniaturized and optimized to accommodate a 96-well plate assay format. Additionally, the linearity and performance at specific wavelengths were determined to enable sensitivity within the pyruvate concentration ranges relevant to the sample matrix.
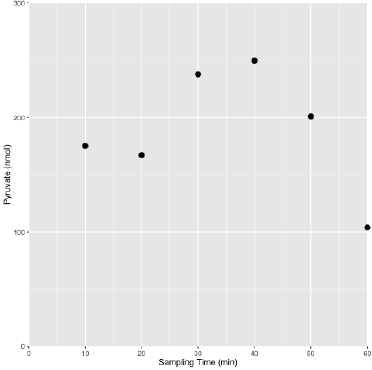
Figure 1: A representative pyruvate profile in sweat obtained from a pyruvate supplemented (Dosed) athlete following the prescribed Dosed exercise protocol.
The general profile of pyruvate levels tended to increase over the course of exertion and decrease towards the end of the assessment period, likely reflecting uptake of available pyruvate to meet metabolic demands and foster recovery. The lower complexity of metabolites in sweat relative to blood or serum permits accurate quantification using chemical quantitative techniques. It was determined that the simple collection technique used, a BandAidTM absorptive pad, offered a substantial recovery volume (400 - 1000 μL) and was determined to be void of interfering substances.
Pyruvate Chemical Determination
Pyruvate concentration was determined using freshly prepared reagents according to the following setup in a 96 microwell plate using 8-channel pipettes for additions and mixing. To each well was added either 50 μL sweat or water and 125 μL of 0.0125% v/v 2,4-dinitrophenyl hydrazine (DNPH) prepared in 2 M HCl. The components were mixed and incubated at room temperature for 10 minutes. Subsequently, 63 μL of 3 N NaOH was added and mixed. The plate held at room temperature for 5 minutes before performing spectrophotometric assessment at the following wavelengths: 420 nm, 450 nm, and 515 nm. Optical densities at each wavelength were compared to a standard curve to obtain corresponding pyruvate concentrations. Pyruvate standards in the range of 0 nM - 500 nM were prepared fresh in milliQ-water and used on the same plate as the experimental samples to ensure consistency. Three replicates for each sample and control were performed.
Results and Discussion
The small volume, high throughput, and low-cost assay presented enables the direct chemical determination of pyruvate concentrations in sweat associated samples and may be suitable for other sample types such as saliva or cell culture supernatants if unpigmented. The assay exhibits linearity at different wavelengths as reflected by the absorption maxima assessed at 420 nm, 450 nm, and 515 nm (Figure 2). Interference from commonly encountered matrix associated compounds such as sugars do not impact accurate quantification [2,21], but it is anticipated that pigmented matrices such as blood and potentially urine may be influenced in a manner akin to the interference of pigments in plant-derived samples [22]. In such cases, alternative, albeit more labor intensive, methodology can be implemented [19]. Alternatively, a suitable wavelength maxima may be selected to minimize interference from pigmented substances. For example, for serum or urine derived samples, wavelengths of 450 nm or preferably 515 nm can be used for standard curve generation.
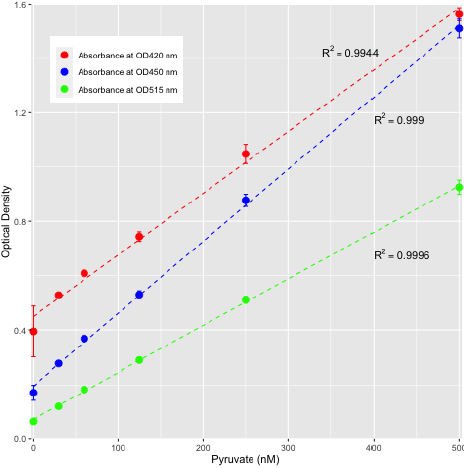
Figure 2: Standard curve for pyruvic acid as determined by assessing various absorption maxima peaks at 420 nm, 450 nm, and 515 nm.
All three wavelengths assessed exhibited linearity across a concentration range of 0 nM - 500 nM pyruvate. Replicates n = 3 for each concentration.
Generally, for sweat samples, a wavelength of 450 nm was used (Figure 3) which permitted the evaluation of timed sweat collected samples to be effectively analyzed from various athletes (Figure 1) as well as the assessment of pyruvate supplementation to be observed over the collection periods, pre- and postpyruvate supplementation (Figure 4). Volume optimization for plant-, specifically onion-derived samples has been proposed [21], but the assessment of pyruvate from mammalian samples has not been attempted. The simple chemical methodology is readily applicable to various settings, scalable, and can be used in a teaching environment with appropriate precautions in place. Additionally, the utility of assessing sweat as a suitable biomarker to infer metabolic status was determined to be implementable and useful post-pyruvate intervention by supplementation and may be extended to the use of pyruvate assessments in tissue extracts [23] once solids have been removed by centrifugation.
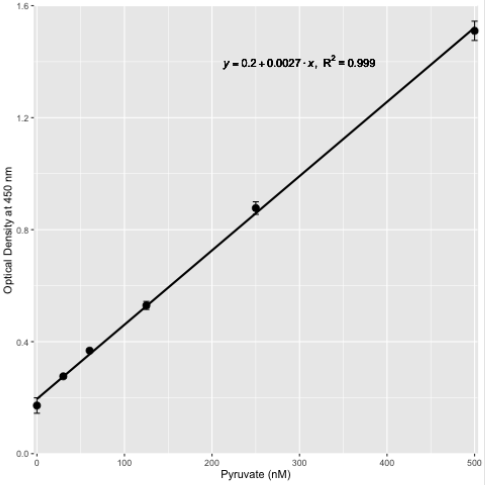
Figure 3: Standard curve for the chemical determination of pyruvate at 450 nm.
Pyruvate levels were determined chemically as described in the text in the range of 0 nM - 500 nM and represented by the mean and standard deviation of n = 3 replicates.
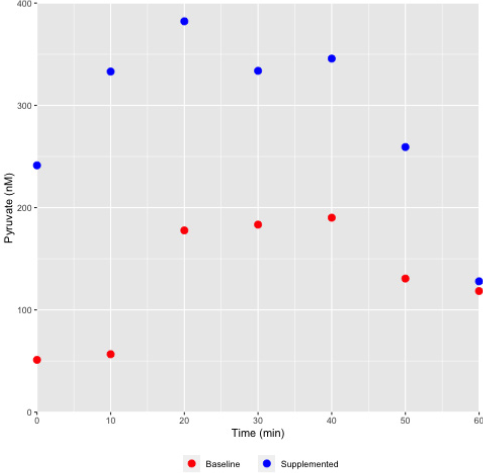
Figure 4: Differential pyruvate concentration profile in sweat collected from a female athlete monitored during the course of exercise.
Sweat was collected at various time points as indicated and the pyruvate concentrations assessed using the chemical method described. As shown, pyruvate concentrations in a representative female athlete were elevated during supplementation with a pyruvate containing nutraceutical supplement (Health Canada NPN80070757), and under both baseline and supplemented states the level would increase with increasing exertion (exercise) time.
Acknowledgement
We wish to thank the excellent technical assistance from Ms. Shuk Yee Ngan and Ms. Kamilia Talipova and greatly appreciate the continued support from Seneca’s School of Biological Sciences and Applied Chemistry and the Applied Research, Innovation and Entrepreneurship staff.
Conflict of Interest
No conflict of interest.
References
- Schwimmer S, Weston WJ (1961) Enzymatic development of pyruvic acid in onion as a measure of pungency. J Agric Food Chem 9: 301-304.
- Sharma K, Lee YR (2016) Effect of different storage temperature on chemical composition of onion (Allium cepa ) and its enzymes. J Food Sci Technol (2016) 53(3): 1620-1632.
- Abayomi LA, Terry LA, White SF, Warner PJ (2005) Development of a disposable pyruvate biosensor to determine pungency in onions (Allium cepa ). Biosens Bioelectron 21(11): 2176-2179.
- Kato M, Masamura N, Shono J, Okamoto D, Abe T, et al. (2016) Production and characterization of tearless and non-pungent onion. Sci Rep 6: 23779.
- Wang Y, Wang J, Cheng W, Zhao Z, Cao J (2014) HPLC method for the simultaneous quantification of the major organic acids in Angeleno plum fruit. Materials Science and Engineering 62: 012035.
- Anthon GE, Barrett DM (2003) Modified method for the determination of pyruvic acid with dinitrophenylhydrazine in the assessment of onion pungency J Sci Food Agric 83(12): 1210-1213.
- Gallina PM, Cabassi G, Maggioni A, Natalini A, Ferrante A (2012) Changes in the pyruvic acid content correlates with phenotype traits in onion clones. Australian Journal of Crop Science 6(1): 36-40.
- Marinozzi M, Sardella R, Scorzoni S, Ianni F, Lisanti A, et al. (2014) Validated Pungency Assessment of Three Italian Onion (Allium cepa L) Cultivars. Journal of International Scientific Publications: Agriculture and Food 2(1): 532-541.
- Bhat A, Bhat M, Prasad K, Trivedi D, Acharya S (2015) Estimation of Pyruvic acid in serum and saliva among healthy and potentially malignant disorder subjects - a stepping stone for cancer screening? J Clin Exp Dent 7(4): e462-465.
- Merante F, Petrova Benedict R, MacKay N, Mitchell G, Lambert M, et al. (1993) A biochemically distinct form of cytochrome oxidase (COX) deficiency in the Saguenay-Lac-Saint-Jean region of Quebec. Am J Hum Genet 53(2): 481-487.
- Merante F, Mickle DA, Weisel RD, Li RK, Tumiati LC, et al. (1998) Myocardial aerobic metabolism is impaired in a cell culture model of cyanotic heart disease. Am J Physiol 275(5): H1673-1681.
- Yoshikawa H, Tokuro S, Fukuyama T (1949) The Levels of Pyruvic and Lactic Acid Following Muscular Activity and Ingestion of Lactate. The Japanese medical Journal 2(1): 32-37.
- Johnson RE, Edwards HT (1937) Lactate and Pyruvate in blood and urine after exercise. Journal of Biological Chemistry 118: 427-432.
- Olek RA, Kujach S, Wnuk D, Laskowski R (2014) Single sodium pyruvate ingestion modifies blood acid-base status and post-exercise lactate concentration in humans. Nutrients 6(5): 1981-1992.
- Merante F, Artuso T, Badulescu C (2020) Pyruvate Levels in Sweat as A Surrogate Biomarker for Intracellular Mitochondrial Metabolite Flux and Supplement Intervention. J Sci & Tech Res 25(2): 18947-18951.
- Maclean IS (1913) The Estimation of Pyruvic Acid. Biochem J 7(6): 611-615.
- Ianni F, Marinozzi M, Scorzoni S, Sardella R, Natalini B (2016) Quantitative Evaluation of the Pyruvic Acid Content in Onion Samples with a Fully Validated High-Performance Liquid Chromatography Method. 2016. International Journal of Food Properties 19(4): 752-759.
- Zhao YY, Gao XF, Li YS, Ju X, Zhang J, et al. (2008) Determination of pyruvic acid by using enzymic fluorescence capillary analysis. Talanta 76(2): 265-270.
- Shapiro F, Silanikove N (2011) Rapid and accurate determination of malate, citrate, pyruvate and oxaloacetate by enzymatic reactions coupled to formation of a fluorochromophore: Application in colorful juices and fermentable food (yogurt, wine) analysis. Food Chem 129(2): 608-613.
- Zhu A, Romero R and Petty HR (2010) A sensitive fluorimetric assay for pyruvate. Anal Biochem 396(1): 146-151.
- Yoo KS, Lee EJ, Patil BS (2011) Underestimation of pyruvic acid concentrations by fructose and cysteine in 2,4-dinitrophenylhydrazine-mediated onion pungency test. J Food Sci 76(8): C1136-1142.
- Beretta VH, Bannoud F, Insani M, Galmarini CR, Cavagnaro PF (2017) Dataset on absorption spectra and bulb concentration of phenolic compounds that may interfere with onion pyruvate determinations. Data Brief 11: 208-213.
- Randle WM, Bussard ML (1993) Streamlining onion pungency analyses. Horticultural Science 28(1): 60.
