info@biomedres.us
+1 (502) 904-2126
One Westbrook Corporate Center, Suite 300, Westchester, IL 60154, USA
Site Map

Received: August 22, 2022; Published: September 01, 2022
*Corresponding author: Hammam M Abdelaal, Department of Information Technology, Faculty of Computers and information, Al-Azhar University, Egypt
DOI: 10.26717/BJSTR.2022.45.007274
The early detection and diagnosis of diseases, which are made possible by artificial intelligence, enable us to begin treatment protocols timely in the early stages of disease progression, which increases the likelihood of treatment and recovery. Artificial intelligence plays an important role in the improvement of healthcare for patients. One out of every eight women will get breast cancer in their lifetime. Worldwide, regionally, and locally, breast cancer is the most frequent kind of cancer (plus 1 in 870 men). Follow up on the recovery and treatment of the patient and predicting whether at the level of the individual or at the level of his family or the generation emerging from it in the future at the long term to prevent it and prognosticate it This paper proposes to present a non-invasive method for diagnosing and classifying breast diseases using mammograms, to identify breast tissue as normal, or abnormal (malignant tumor, or a benign tumor), and to identify breast tissue as normal, or abnormal (malignant tumor, or a Supervised Learning algorithms, primarily Random Forest (RF) and Decision Tree (DT) Classifiers, are used to classify breast tissue as either malignant or benign based on a number of features that can reach up to thirty features, including the breast mass, its size, diameter, and circumference, and whether or not the tumor is a cyst or a solid tumor. These features are primarily the most important factors in the classification process. The results showed that RF achieved higher accuracy, which is reached up to 96.9 percent, followed by DT classifier with 95 percent respectively, and finally the model is evaluated using 10 folds cross-validation (CV), which is the best method to evaluate the model, because it depends resampling that uses different folds of the data to test and train a model on different iterations to make the model more generalization.
Keywords: Breast Cancer; Dataset; Supervised Learning Algorithms; Decision Tree; Random Forest; Crossvalidation
Abbreviations:: DT: Decision Tree; RF: Random Forest; BN: Bayesian Networks; SVMs: Support Vector Machines; CAD: Computer-Aided Design; RBF: Radial Basis Function Network; GLCM: Grey Level Co-Occurrence Matrix; PS: Percentage Split; TP: True Positive; TN: True Negative; FP: False Positive; FN: False Negative
Health is a great gift and it is considered as a crown on the heads of healthy people that only those who suffer from its loss can sense, as human life is the blessing of health in the body and self, where it must be preserved because it is a trust that God has commanded us to preserve. Taking care of human health is the responsibility of the individual himself first, and the responsibility of the country second which must provide the necessary treatment. You also see many governments that are exposed to the spread of epidemics and diseases among their individuals spend a large part of the money and efforts to buy drugs to treat those cases and it is possible with spending all the money and efforts made, these diseases could be deadly and spread to parts of the earth, as happened in with the spread of the corona epidemic. You could have saved money for development in other fields if the country was rich. As for poor countries, it is difficult for them to provide treatment and it will become a spot full of epidemics that can spread the epidemic to the rest of the world. And because a healthy person from diseases is the person best able to serve himself, his nation, and his society, the sick person sees him as weak, frail, and unable to perform duties the person becomes dependent on other people which affects his psyche as well because of his sense of helplessness and weakness it may affect society, causing poverty and weakness, and also may cause epidemics, so the importance of health for a person is that it saves him the costs of treatment and the hassle of going to the hospital.
As for the presence of healthy individuals in society, this means the presence of productive individuals who possess strength and the ability to give and evolve. Cancers, particularly breast cancer, are among the most devastating to human health and society. Approximately 685,000 women will lose their lives to breast cancer in 2020, making it the leading cause of cancer mortality in women. The majority of breast cancer diagnoses and deaths will occur in low- and middle-income nations, where it will afflict 1 in 8 women (plus 1 in 870 men). The 5-year breast cancer survival rate exceeds 90% in highincome nations, but not in India or South Africa. AI has improved, served, and solves issues in many domains, including medicine. Using AI-based algorithms such as DT, NB, KNN, and SVM to construct software that looks for breast cancer using mammograms and scripts is a potential technique to increase digital mammography imaging accuracy.
In this part, some of the relevant efforts that have previously been done on breast cancer detection by researchers utilizing various machine learning algorithms are addressed. These researchers have used a variety of different methodologies. Wei et al. offered an automated categorization of breast cancer in their study [1], which was based on breast pictures. The suggested technique classifies photographs of tumors as either benign or malignant based on their texture and their morphological characteristics. The approach that has been developed utilizes a total of 1061 ultrasound pictures, with 472 benign and 589 malignant tumors being represented. The direct least-squares fitting of ellipses, compactness, and the radial range spectrum are some of the properties that were recovered from the ROI. The SVM classifier was used so that morphological characteristics could be categorized. The findings, which were based on morphological characteristics, produced an accuracy rate of 75.94 percent, a sensitivity rate of 66.37 percent, a specificity rate of 86.87 percent, and a precision rate of 85.23 percent. The cad for breast tumor classification was created by (Liu, et al. [2]), and it is based on the extraction of edge features. Roughness, regularity, aspect ratio, elasticity, and roundness were among the morphological parameters that were recovered from the ROI. Other properties that were extracted were roundness.
It was decided to use the SVM classifier to determine the nature of the lesions in the pictures and determine whether they are benign or malignant. The approach that was suggested made use of a total of 192 ultrasound scans, with 71 benign and 121 malignant cases included among them. The suggested technique attained an accuracy of 67.31 percent, a sensitivity of 47.62 percent, a specificity of 80.65 percent, a positive predictive value (PPV) of 62.50 percent, and a negative predictive value (NPV) of 69.44 percent. Support Vector Machine (SVM), Random Forest (RF), and Bayesian Networks (BN)were the three types of machine learning methods that were examined in (Dana Bazazeh, et al. [3]) comparative study on the subject. As a training set, we used the original breast cancer data set from the state of Wisconsin. The findings of the simulations that were carried out demonstrated that the performance of categorization shifts depending on the strategy that was chosen. According to the findings, support vector machines (SVMs) have the best performance with regard to accuracy, specificity, and precision. The RFs, on the other hand, have the best likelihood of accurately diagnosing the tumor. Andre. E and colleagues [4], published a detailed study that categorized various skin lesions. They used a technique called “convolution Neural Network” to classify the lesions after first dividing them into twenty-three distinct types.
They accomplish this categorization by using the 19 layer and 16 layer models developed by the Visual Geometry Group, which are designated respectively as VGG-19 and VGG-16. (A Andre E, et al [5]), improved the performance of a pre-trained VGG model by using the technique of transfer learning. They were able to attain an accuracy rate of 90 percent when classifying lesions into the binary categories of malignant or non-cancerous. Nevertheless, a number of different algorithms have been used in order to successfully identify melanomas. (M Kalaiyarasi, et al. [6]), performed SVM, KNN, and logistic regression are standard classification techniques, Kaggle’s breast cancer dataset. Training and testing data were divided 7:3. Correlation matrix determines significant traits. The suggested technique predicted the categorization model. After developing the model, metrics determined the most efficient categorization model. The suggested technique classifies benign and malignant tumors better.
Future optimization strategies will obtain above 99 percent metrics. (R Vijayarajeswari, et al. [7]), a Hough transform was offered as a method for identifying mammography picture characteristics. These characteristics are inputs into the SVM classifier that are employed. The SVM classifier was able to reach an accuracy range of 94 percent, which is higher than the accuracy range that was attained by the LDA classifier (86 percent). (Ibrahim AO, et al [8]), a computer-aided design (CAD) system for breast diagnostics was developed utilizing the Radial Basis Function Network (RBF) approach. The decision-making system is used in the process of tumor classification using RBF network classifiers. The proposed study examines the relationship between RBF neural networks and MLP algorithms. The overall performance of the RBF neural network resulted in an accuracy of 79.166 percent, while the accuracy of the MLP algorithm was only 54.1667 percent. This demonstrated that the RBF neural network is capable of successfully classifying the mammogram images with higher classification accuracy. The study conducted by Rebecca Moussa and colleagues was able to distinguish melanoma from benign lesions by employing k-Nearest Neighbor and geometric feature algorithms [9], This allowed the researchers to detect melanoma.
In spite of the fact that they only had a little dataset to work with, they nevertheless managed to achieve an accuracy of 89%. Calculating a Total dermatoscopy Score, often known as a TDS, is one method that has been applied in the past. This score is used to differentiate between benign and cancerous skin lesions. An Artificial Neural Network approach was used by (A Masood, et al. [10]) in order to categories 135 photos into categories of malignant and non-cancerous lesions. They used a Fuzzy C Mean Method for Level Set Initialization to classify the photos, with the classification being determined by Histogram Analysis. The extracted characteristics were created by using the features of the histogram as well as the similarity measures that were derived from the grey level co-occurrence matrix (GLCM) [11]. Then, a two-layer feedforward Neural Network was developed using three different training methods: resilient back propagation, scaled-conjugate gradient, and Levenberg-Marquardt. They were able to get an accuracy rate of 91.9 percent by training using the Scaled Conjugate Gradient approach [12]. (Azmi, et al [13]), who also offered a TDS score that was reliant on the attributes that were generated using the ABCD method. [Citation needed] The range of possible TDS scores is from 1.0 to 8.9, and a value that is more than 5.45 indicates that the lesion was most likely type a. Melanoma
Building a model that is able to distinguish and classify breast cancer into benign or malignant tumors based on some statistical characteristics extracted from mammograms, in addition to predicting its occur in the future (long -term) based on some other checkup such as pathological history or the genetic factor. The general framework, the person goes to the laboratory for examination and the assistants help the person to use the mammogram to take the x-ray image and the required data, this image is as an input for the system to extract some of important the features, based on these features the model can classify and differentiate image categories, to identify breast tissue as malignant tumor, or a benign tumor and Follow up on the recovery and treatment of the patient and predicting whether at the level of the individual or at the level of his family or the generation emerging from it in the future at the long term. If the diagnosis is a benign tumor, the hospital system is informed and the person is taken there to monitor their status for non-cancer, receive the necessary treatment, monitor their response to treatment, and predict the person’s likelihood of developing cancer. Finally, if the diagnosis of cancer is located, the stage of the cancer is determined, the hospital system is informed, and the person is taken there to receive the necessary treatment. Also, a prediction is made about whether a patient will develop cancer again in the future and predict for the next generation whether or not they will develop cancer.
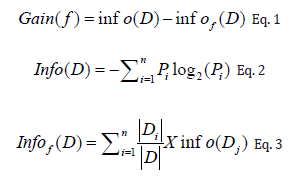
Breast cancer prediction uses a classifier model to describe and classify breast cancer classes. The derived model is based on the analysis of a series of images with known class labels to extract features and feature selection to choose the most significant, targetrelated attributes. The classifier learning method classifies breast cancer into benign and malignant based on images features. The suggested system is made up of many phases, the most important of which are: To extract the characteristics from a picture, read it [14]. The most important features, which are more related to the target class, are selected using the Information gain technique, which is used to measure the dependence between features and labels and calculates the gain between the (i-TH) feature f i and the class labels according to equation 1, after calculating both of the expected information needed to classify a tuple in D is given by equation 2, and the expected information needed to classify a tuple in D is given by equation 3.
(Figure 1) show the features that are used as dataset to train and learning the classifier to predict and identify breast tissue as malignant tumor, or a benign tumor, it contains 570 sample, each sample has 30 features. The data set is spited into training and testing using 10 folds cross-validation (CV) and percentage split (PS) methods. Data set contains of 570 samples as shown in (Figure 2), each sample has 30 features mainly: smoothness mean, perimeter mean, compactness mean, symmetry mean, perimeter worst and concavity worst. In cross validation, the dataset is divided into 10 folds. We use 9 of those parts for training and reserve one tenth for testing. We repeat this procedure 10 times each time reserving a different tenth for testing and calculate the accuracy for this iteration, and the end we get the overall accuracy, by calculate the mean these 10 measures as shown in (Figure 3). While in the percentage split, the dataset is divided randomly into 70% of the data set is used to train the model and 30% is used to test the model as shown in (Figure 2).
Note: Figure 1 show the features that are used as dataset to train and learning the classifier to predict and identify breast tissue as malignant tumor, or a benign tumor, it contains 570 sample, each sample has 30 features
Figure 1: Feature Ranking according to its weight.

Figure 2: Sample of dataset.

Figure 3: F1-score, Recall, and Precision for each category using RF and DT Classifier using CV method.

There are many algorithms that are used to train classification model from the data that can be used to predict the classes of new dataset is unseen samples. In supervised learning, the data are labeled with pre-defined classes such as Multinomial, Bernoulli NB, Logistic Regression, SGD Classifier, SVC, Linear SVC, Nu SVC, Decision Tree Classifier, and Random Forest Classifier. In this study we used the most of these algorithms to identify the best classifier gives high accuracy, to predict the class of breast cancer, based on mammography; it is a special type of x-ray imaging used to create detailed images of the breast. After the experimental results, we reported the best two classifiers of them, which have a highest accuracy mainly: Decision Tree and Random Forest Decision Tree Classifier The learning process is two stages, the first Learning (training): Learn a model using the training data, and the second is testing: Test the model using unseen test data to assess the model accuracy
End-stage evaluation and testing for classifiers assess and test classifiers; to confirm experimental findings and determine classifier’s capacity to distinguish between distinct picture classes in order to make the proper final conclusion. The model’s accuracy is assessed using a variety of metrics, including the Recall, Precision, and F-measure, as illustrated in (Figure 4) [15],which determines the TP (True Positive), TN (True Negative), FP (False Positive), and FN (False Negative).
Figure 4: Confusion Matrix between two classes Positive and Negative.

TP: sick people correctly identified as sick. TN: Healthy people correctly identified as healthy.
FP: Healthy people incorrectly identified as sick. FN: Sick people incorrectly identified as healthy.
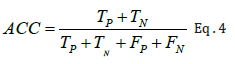
Accuracy this checks to see what percentage of samples have been accurately categorized. In accordance with equation 4, it gives an assessment of the degree to which the results correspond to the original outcome.
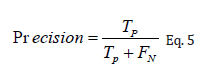
The precision measure determines how accurate the behavior of the recommended technique is by comparing the actual TPs to the ones that were anticipated; the evidence for this may be seen in equation 5.
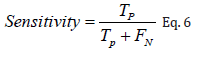
Equation 6 defines recall or sensitivity as the rate of accurate positive sample detection. It equation improves test results.
F-measure is the harmonic mean of precision and recall, giving each the same weighting. It allows a model to be evaluated taking both the precision and recall into account using a single score, which is helpful when describing the performance of the model and in comparing models
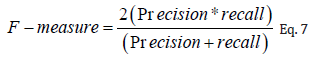
Table 1: Overall accuracy using percentage split and crossvalidation methods for each classifier.

Table 2: The confusion matrix for RF and DT using PS method.

Table 3: The confusion matrix for RF and DT using CV method.

Many classifiers have been used in this study, to identify the best classifier gives high accuracy. (Table 1 & Figure 4) show the Overall accuracy using percentage split and crossvalidation methods for Random Forest and Decision Tree. The Experimental results have been evaluated and tested by Python Program. The Experimental Results and its applications have developed using Python The confusion matrix show a table used to define the performance of a classification algorithm; it visualizes and summarizes the performance of a classification algorithm. A confusion matrix is shown in (Tables 2 & 3), where benign tissue is called healthy and malignant tissue is considered cancerous; where the diagonal is represent the no of samples that are correctly classified as shown in (Tables 2-3), according to this equation 8
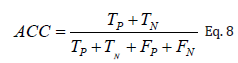
Table 4: F1-score, Recall, and Precision for each category using RF and DT Classifier using CV method.

Table 5: F1-score, Recall, and Precision for each category for DT Classifier using PS method.

Table 6: F1-score, Recall, and Precision for each category for RF Classifier using PS method.Conclusion

(Table 4 and Figure 5) show the results of the F1-score, Recall, Precision and the support count (no of samples in each class), which generated by the two classifiers RF, and DT for each category, when the model is evaluated using cross-validation method. In the experimental results, we used two methods for each classifier to conduct results of experiments; in each method we reported the results within the training and testing stage. The two methods are percentage split and 10 folds cross-validation. The dataset in percentage split method is divided into two parts: training and testing. The training data consist of 70% of the data per category while the testing data is 30%. In the Cross-validation the training data is divided randomly into (n) folds, each fold held out once and the classifier is trained on the remaining (n-1) blocks. (Table 5 and Figure 6) show the results of the F1-score, Recall, Precision and the support count (no of samples in each class) for each category, which generated by the DT classifier in two stages, training and testing, when the model is evaluated using percentage split method. (Table 6 and Figure 7) show the results of the F1-score, Recall, Precision and the support count (no of samples in each class) for each category, which generated by the RF classifier in two stages, training and testing, when the model is evaluated using percentage split method (Figure 8).
Figure 5: Overall accuracy using percentage split and cross-validation methods for each classifier.

Figure 6: F1-score, Recall, and Precision for each category for DT Classifier using PS method.

Figure 7: F1-score, Recall, and Precision for each category for RF Classifier using PS method.

Figure 8: Outline of the Breast cancer detection system.

Artificial intelligence systems are used extensively in medical applications, such as the diagnostic and treatment, supporting the physician to take a final decision in diagnostic state, in addition to predicting the disease before it occurs or discovering it in its early stages, using learning algorithms for the purpose of building a classifier model. Examples of these applications include the diagnostic and treatment. Within the scope of this investigation, we construct a classifier model using RF and DT. On the basis of an examination of a series of mammograms, it is possible to provide a description of breast cancer as well as differentiate between benign and malignant tumors. Because of their capacity to identify to identify the most important features in the data set that are most relevant to the each class, the results showed that RF achieved higher accuracy, which is reached up to 96.9 percent, followed by DT classifier with 95.1 percent respectively. This is due to the fact that DT classifier is able to identify the most important features in the data set. The final step in the process involves performing a 10 folds cross-validation (CV) evaluation on the model. This evaluation depends on resampling, which employs a different fold of the data to test and train the classifier on various iterations, and as a result, it provides accurate results when the model is put to the test with unseen samples.


