 Short Communication
Abstract
Aims: This paper presents estimates of the spread rate of Covid-19 in Canada, Mexico, and the USA from the early days of 2020 to October 9, 2021.
Methods: Because it is impossible to measure and model all of the forces that can affect this spread rate, a statistical technique is used that produces a separate spread rate for each observation where differences in these estimates are due to omitted variables. Some of the most important omitted variables whose influence on the spread rate is captured in this paper’s estimates include the imposition of social distancing laws, the degree that social distancing laws are observed, what percent of the population has been vaccinated and who was vaccinated, mutations of the virus, the density of the populations, and weather conditions. This paper’s estimates are of the change in Covid-19 cases in time period t+1 due to an additional case in time period t [d(cases t+1)/d(cases t)] where t and t + 1 are one week apart.
Results: I found that if the number of Covid-19 case can be reduced by one in time t then the number of cases in time t+1 fall by less than one; in contrast if the number of cases in time t rise by one, then the number of cases in time t+1 increases by more than one.
Conclusion: it is harder to kill Covid-19 than it is for Covid-19 to spread. Thus governments and people should do all that they can to fight this disease.
Keywords: Covid-19; Spread Rates; Omitted Variables; Reiterative Truncated Projected Least Squares; North America
Abbreviations: RTPLS: Reiterative Truncated Projected Least Squats; VSOLS: Variable Slope Ordinary Least Squares; BLUE: Best Linear Unbiased Estimate
Introduction
Leightner, Inoue, and Lafaye de Micheaux [1] are the first researchers to apply a variable slope estimation procedure to the spread of an infectious disease – Covid-19 [2]. They applied this technique to data from Brazil, Europe, South Africa, the United Kingdom, and the USA for early 2020 to the end of March 2021. They used weekly data on the number of “new” Covid-19 cases to estimate the change in “new” Covid-19 cases next week due to one more “new” Covid-19 case this week. I follow what they did in some ways and deviate in others. Specifically, I continue to use a one week lag because the Center for Disease Control [3] says that the medium incubation period for Covid-19 is four to five days and the data available for North America is weekly. However, I deviate from what Leightner, et al. [1] did by using the number of cases of Covid-19 in time periods t and t + 1 instead of the number of “new” Covid-19 cases. I made this change because all current cases of Covid-19 can spread the disease, not just “new” cases. Leightner, et al. [1] data ended in March of 2021, but the data for this paper extends through October 9, 2021.This extension of the data is important because the Delta variant of Covid-19 hit North America after March of 2021, and the Delta variant is much more infectious. Finally, I find estimates for the spread rate of Covid-19 in Mexico and Canada – two countries not examined by Leightner, et al. [1]. I use the same variable slope estimation technique employed by Leightner, et al. [1] which is Reiterative Truncated Projected Least Squares (RTPLS).
Materials and Methods
The data was downloaded from the webpage of the European Centre for Disease Prevention and Control (2021) [4]. I began the data series for each country at the point when that country’s number of Covid-19 cases remained above one for the rest of the data set. This resulted in Canada’s and the USA’s data starting in the fourth week of 2020 and Mexico’s data starting in the seventh week of 2020. The data is presented on the left side of Table 1 and depicted in Figure 1. Leightner, et al. [1] use simulation tests to compare and contrast three different variable slope estimation methods – variable slope ordinary least squares (VSOLS), variable slope generalized least squares (VSGLS), and reiterative truncated projected least squats (RTPLS). Although VSGLS is theoretically the best linear unbiased estimate (BLUE), Leightner, et al. [1] used RTPLS because simulations show that RTPLS produces noticeably less error than VSGLS when all the variation in the dependent variable is due to omitted variables and RTPLS captures non-linear relationships better than VSGLS and the spread of a disease is nonlinear [5]. Simulations show that VSOLS was always far inferior to both VSGLS and RTPLS.
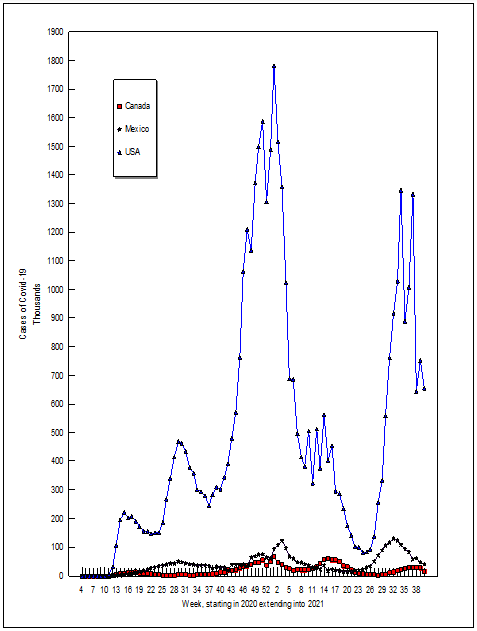
Figure 1: Number of Cases of Covid-19.
All three variable slope estimation methods are built upon the
following ideas:
(1) Omitted variables destroy the reliability of estimated
coefficients and statistics when they affect the estimated slope
(if an omitted variable does not affect the slope in the sample
or population, then it merely adds more random noise to the
estimation, and does not bias the estimates),
(2) If omitted variables affect the estimated slope and they are
ignored, then the estimation procedure produces a constant
slope, when in truth the slope varies due to the omitted
variables (thus the resulting estimates are hopelessly biased),
and
(3) Omitted variables will affect the relative vertical position of
observations [6].
All three variable slope estimation procedures use the relative vertical position of observations to capture the influence of omitted variables; all three produce a separate slope estimate for every observation where differences in these slope estimates are due to omitted variables. Variable slope estimation produces estimates that show all the ways that the dependent and independent variables are related (i.e. total derivatives); in contrast to more traditional estimation techniques which produce estimates holding all other included variables constant (thus, partial derivatives). Leightner, et al. [1] explain all three variable slope estimation procedures, test all three using simulations, and then uses RTPLS to estimate the spread rate of Covid-19 as described above. Leightner, et al. [7] and Leightner [8] explain RTPLS and present the mathematical equations used in it. Both Leightner, et al. [1] and Leightner, et al. [7] are open access articles. Published applications of RTPLS include estimates of the inflation/unemployment tradeoff, pollution abatement, effectiveness of monetary, fiscal, exchange rate, and trade policies, and the effects of China accumulating US dollars on the value of the US dollar and on the US trade deficit.
Results
Figure 1 plots the data over time. The two upward spikes in the number of Covid-19 cases in the USA correspond to new variants of the virus. Variant B.1.1.7 hit the world in September 2020 (≈week 38) and the Delta variant hit North America in June of 2021 (≈week 25) (Center of Disease Control and Prevention, 2021) [9]. Figure 1 shows that Mexico and Canada also experienced these new variant spikes (although Canada’s Delta spike occurred with a 6 week lag). The noticeable declines in Covid-19 cases in early 2021 in all three countries corresponds to when vaccines were first available. The estimates for d(cases of Covid-19 in t+1)/d(cases of Covid-19 in t) are given in the right half of Table 1 and depicted over time in Figure 2. The d(cases of Covid-19 in t+1)/d(cases of Covid-19 in t) estimates are highest and most unstable when Covid-19 first emerged in each country. The d(cases of Covid-19 in t+1)/d(cases of Covid-19 in t) value for Canada in the fourth week of 2020 means that an additional case in that week would be correlated with 8.466 additional cases the next week. A close examination of Figure 2 reveals some common trends for all of North America: (1) from 2020 week 13 through the end of 2020 d(cases of Covid-19 in t+1)/ d(cases of Covid-19 in t) estimates were on an upward trend, (2) d(cases of Covid-19 in t+1)/d(cases of Covid-19 in t) fell in early 2021 as vaccinations become available, (3) d(cases of Covid-19 in t+1)/d(cases of Covid-19 in t) again rose between weeks 4 and 13 of 2021, then fell between weeks 14 and 22, rose again between weeks 21 and 30, and then fell after week 30 of 2021.
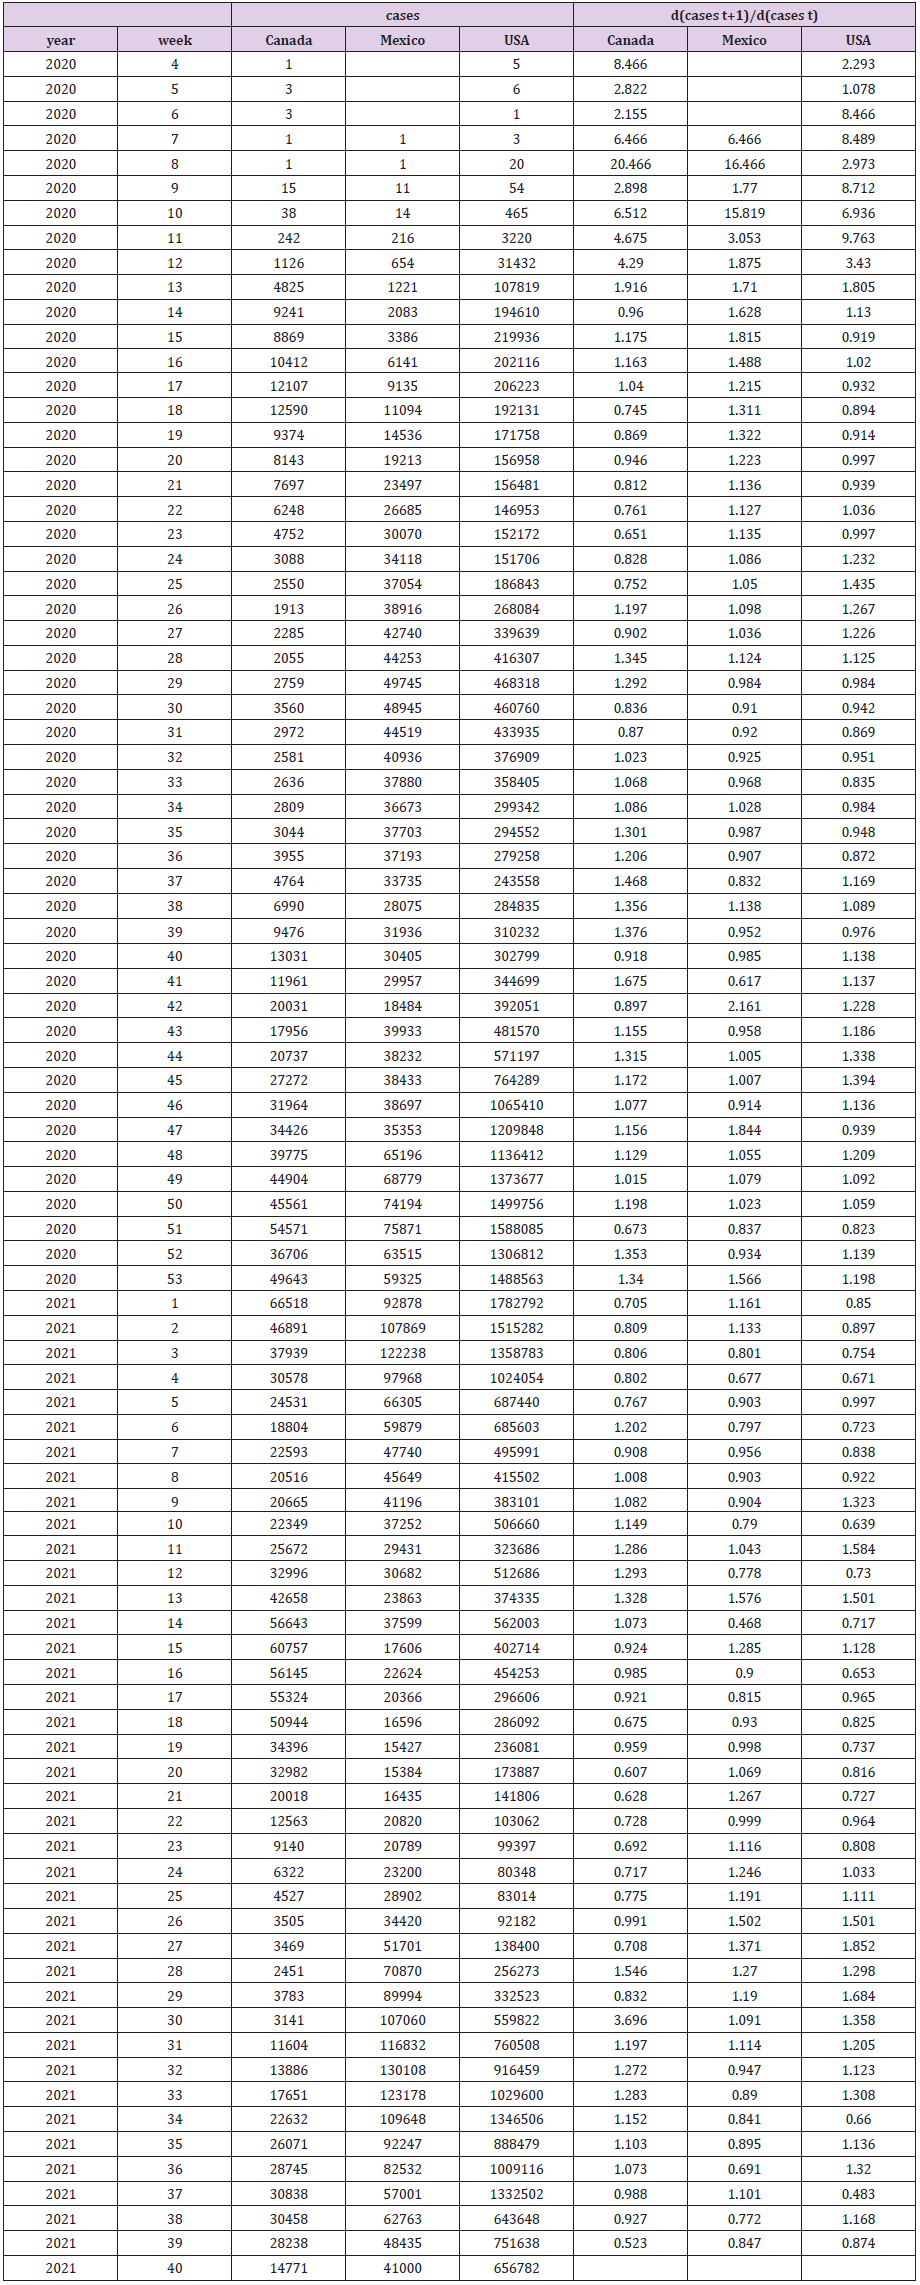
Table 1: The Data and Empirical Estimates.
Discussion
It should be noted that the estimates of d(cases of Covid-19 in t+1)/d(cases of Covid-19 in t) given in Table 1 and depicted in Figure 2 are for both increases and decreases in the number of cases in time t. However, every time the estimate of d(cases of Covid-19 in t+1)/d(cases of Covid-19 in t) was less than one, Covid-19 cases declined the next time period. This means that if Canada, Mexico, and/or the USA could reduce the number of cases in time t by one [perhaps by stricter social distancing laws, mandating vaccines, or rapid testing and quarantining [10], then the number of cases in time t+1 would decline by less than one. However, if something (like a new Covid-19 mutation or more humid, cooler weather) would increase the number of Covid-19 cases in time t, then the number of cases in time t+1 would increase by more than one. Thus it is harder to kill this virus than it is for it to spread. Governments and people need to do all that they can to beat this virus, because it is easier to spread than it is to defeat.
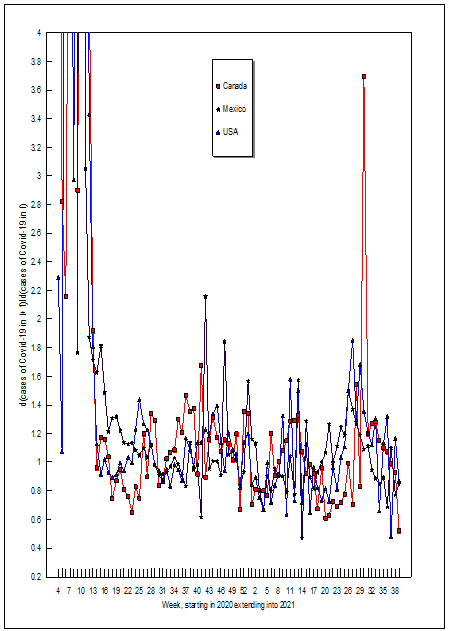
Figure 2: d(Cases of Covid-19 in t+1)/d(Cases of Covid-19 in t).
Declarations of Interests
None.
• This research did not receive any specific grant from
funding agencies in the public, commercial, or not-for-profit sectors.
References
- Leightner, Jonathan E, Tomoo Inoue, Pierre Lafaye de Micheaux (2021) Variable Slope Forecasting Methods and COVID-19 Risk. Risk and Financial Management 14: 467.
- Choi, Youngah (2021) COVID-19 Disease and Treatment of COVID-19. Biomed J Sci & Tech Res 39(2): 2021.
- Nishiura Hiroshi, Natalie Linton, Andrei Akhmetzhanov (2020) Serial interval of novel coronavirus (COVID-19) infections. International Journal of Infectious Diseases 93: 284-86.
- European Centre for Disease Prevention and Control. 2021. COVID-19 Update Situation,Worldwide.
- Sharma, Sunil Kumar, Aashima Bangia, Mohammed Alshehri, Rashmi Bhardwaj (2021) Nonlinear Dynamics for the spread of Pathogenesis of COVID-19 Pandemic. Journal of Infection and Public Health 14: 817-831.
- Branson, Johannah, Charles Albert (Knox) Lovell 2000. Taxation and Economic Growth in New Zealand. In Taxation and the Limits of Government. In: Gerald W. Scully and Patrick James Caragata (Eds.)., Boston: Kluwer Academic, p. 37-88.
- Leightner Jonathan E, Tomoo Inoue (2012) Solving the Omitted Variables Problem of Regression Analysis using the Relative Vertical Position of Observations. Advances in Decision Sciences.
- Leightner, Jonathan E (2015) The Limits of Fiscal, Monetary, and Trade Policies: International Comparisons and Solutions. Singapore: World Scientific.
- Center for Disease Control and Prevention. 2021. Science Brief: Emerging SARS-CoV2 Variants.
- Halvatsiotis, Panagiotis, Eleni Routsi, Michail Papapanou, Argyris Siate¬lis, et al. (2021) High Resolution Melting Curve for the Rapid and Efficient Detection of SARS-Cov-2 Gene Variation in the Greek Population. Biomed J Sci & Tech Res 39(3): 2021.
