 Research Article
ABSTRACT
This study aims to investigate the association of body weight misperception and handgrip strength (HGS) in elderly Koreans. A total of 1,199(male=572, female=627) elderly subjects (age ≥ 65 years), who participated in the Seventh Korea National Health and Nutrition Examination Survey (KNHANES VII-1, 2016) were analyzed. Participant’s hand grip strength, Body Mass Index (BMI), and perceived body weight were measured. By comparing participants’ perceived bodyweight category with their actual bodyweight category, participants were divided into three groups: correct estimate, underestimate, and overestimate. In results, the odds of sarcopenic HGS tended to increase with underweight perception but tended to decrease with normal weight perception(ORs: 2.54, 95% C.I: 1.527-4.230). Compared with the Obese group by BMI categorization, the underweight group, BMI under 18.5, increased ORs 4 times of sarcopenic HGS. Compared with correct estimated weight status, underestimation and overestimation of weight status were high odds of sarcopenic HGS (ORs: 3.21, 95% CI: 1.230-8.381 and ORs: 3.954, 95% C.I: 1.479-10.542). In conclusion, this study supports the hypothesis that weight misperception and the accuracy of the perceived weight are related to HGS.
Abbreviations: HGS: Handgrip Strength; BMI: Body Mass Index; ADLs: Activities of Daily Livings; ORs: Odds Ratio; CIs: Confidence Intervals
Introduction
Research on body weight perception in the adult population
suggests that women have body shape ideals significantly smaller
in size than their perceived current body shapes, whereas men are
equally divided between those who want to be bigger than their
perceived current shape. Research on the relationship between
body weight perception in young adults suggests that regular
participation in exercise can bring about positive changes in body
image and self-concept. Handgrip strength (HGS) has been used to
indicate muscle strength and as an important marker of frailty [1].
The reduction of dominant HGS in the older population undermines
the Activities of Daily Livings (ADLs) such as washing, dressing,
using the toilet, showering, defecating, and mobility. Further, HGS is
largely proven as an explanator of overall strength, fractures, falls,
cognitive impairment [2], and Metabolic syndrome [3].
To avoid weak muscle strength status and alleviate all risks
above, we need to understand related factors and the relation
between HGS and weight control in this population. Previous
research, however, shows inconsistent results. Long-term
overweight and obese status have been associated with lower
HGS among the older population [4]. Others, however, reported
that being underweight [5], higher fat mass, and weight loss
are associated with weak muscle strength [6]. Meanwhile, the
association between weight misperception perceived weight
status, and handgrip strength is unclear. Recently, Lee [7] reported
that fatter weight perception, correct weight estimation, and
overestimated body weight was associated with a lower risk of
decreased HGS in Korean adults. However, this association between
HGS and bodyweight misperception in the senior population is
unclear. Therefore, the present study was designed to examine
the association between body weight misperception and handgrip
strength in older adults.
Method
Study Population
This study is the second analysis of the data acquired in the KNHANES VII-1, 2016. The KNHANES has been examined since 1998 to assess the Korean population’s health and nutritional status. This survey utilized a multistage, complex, stratified, probability cluster survey of a representative sample of the noninstitutionalized population in South Korea. The annual sample of the survey is around 10,000-12,000 persons; 4600 households are selected and surveyed from a panel. The KNHANES VII-I consists of the nutrition survey, the health exam, and the health interview survey. Among a total of 8,150 persons age 19 and older who completed KNHANES VII-I, we used data 1,199 whose aged over 65 years and who had handgrip strength (HGS), BMI, body perception survey data (Figure 1).
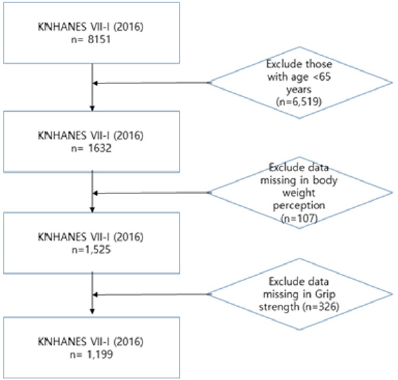
Figure 1: Flow diagram for selection of study subjects.
Ethics Statement and Data Access
Access to the KNHANES data was acquired after getting approval from the Korea Center for Disease Control and Prevention. This study is a secondary analysis that used and analyzed the data from 2016 KNHANES data collected; therefore, approval from IRB was exempted and not required.
Data Collection
The data for this study comprises participants in the KNHANES 2016. Sociodemographic variables are age, gender, level of education, household income, marital status, regular exercise performance. Education level was classified as below elementary level, middle school graduate (<9 years of school), High school graduate (10-12 years of school), and college or above (>13 years of education). Monthly household income was divided by the number of family members and classified into quantifies for household income. For marital status, those with a spouse were defined as ‘with the spouse,’ singles after divorced as ‘divorced,’ singles of the widow, and widower as ‘widow/widower.’ Regular resistance exercise was defined as performing.
Assessment of Hand Grip Strength (HGS), BMI, Body Perception Parameter
Handgrip strength was measured three times in each hand
with a grip strength dynamometer (TKK5401; Takei Scientific
Instruments, Co., Ltd., Tokyo, Japan). Trained technicians instructed
subjects to hold measures with the distal interphalangeal finger
joints of the hand at 90 degrees to the handle and squeeze the
handle as hard as possible. We analyzed data of max HGS for this
study. Sarcopenic handgrip strength (HGS) was defined as the mean
value of HGS <27kg for men and <16kg for women Cruz-Jentoft, et al.
[8]. Bodyweight and height were measured, and BMI was calculated
as weight divided by height squared (kg/m2). Based on the Korean Society for the Study of Obesity practice guidelines Korean
Society for the Study of Obesity [9], we classified BMI into four
groups according to BMI: underweight (BMI<18.4kg/m2), normal
weight(18.5≤BMI<23.0kg/m2), overweight (23≤BMI<25kg/m2),
moderate obesity (25≤BMI<30kg/m2) and severe obesity(30kg/
m2≥BMI). BMI classification was collapsed into a three-tier variable:
in each BMI category, ‘underweight’ was labeled as ‘underweight,’
‘normal’ and ‘overweight’ were re-labeled as ‘normal,’ and
‘moderate obesity and severe obesity were re-labeled as’ obesity.’
Body perception was asked to each participant as rate his
or her body weight as very underweight, underweight, normal,
overweight, and very overweight. The responses to body weight
were re-categorized into a three-tier variable: In each perception of
body weight, ‘very underweight’ and ‘underweight’ were considered
as ‘underweight,’ ‘normal’ was considered as ‘normal,’ ‘overweight’
and ‘very overweight’ were considered as ‘overweight.’ By
comparing participants’ perceived bodyweight category with their
actual bodyweight category, participants were divided into three
groups: correct estimate (the group with the agreement between
BMI category and self-recognized body weight), underestimate
(group recognized as lighter than BMI criteria), and overestimate
(group recognized as heavier than BMI criteria).
Statistical Analysis
A Chi-square test or t-test was conducted to compare characteristics between participants with normal HGS and those with sarcopenic HGS. In all participants, multiple logistic regression analyses were conducted to estimate the odds ratio (ORs) and 95% confidence intervals (CIs) between the gap of body perception and grip strength, as well as between BMI categories and selfperceptions of the body using IBM SPSS version 22.0(IBM CO, Armonk, NY, USA). We also conducted a chi-square test to analyze differences in variables from baseline characteristics. The covariate included were age, education, household income, and resistance training.
Results
Baseline Characteristics
The general characteristics of subjects are shown in Table 1. The study population included 572 men (mean age 72.18 years) and 627 women (mean age 72.15 years) from KNHANES VI-1. There was no difference in mean age between men and women. While 58.6% of the men had more than middle school education, only 27.1% among women (F=141.19, p<.001). While 88.2% of men have a spouse, it was only 54.3% among women, and widowhood was more prevalent in women than men (42.0% vs. 7.6% among men, F=186.38, p<.001). As for household income, 41.3% of men and 52.6% of women had the lowest quartile (F=16.26, p<.001). When classified by BMI category, 33.0% and 42.1% of the men and women were classified as overweight/obese, while 3.0% and 2.2% were underweight, respectively (F=10.61, p<.01). Among 1199 subjects, 8.9% of subjects(n=107) had underestimated, that was, seniors’ perceived body weight was lighter than their actual body weight. 61.6% of seniors (n=739) had accurately estimated, that was, perceived their body weight was consistent to their actual body weight; 29.4% of subjects (n=353) had overestimated, that was, they perceived their body weight heavier than their actual body weight. More women (10.5% vs. 7.2%) underestimate their actual body weight compared with objective measures (F=11.01, p<.01).
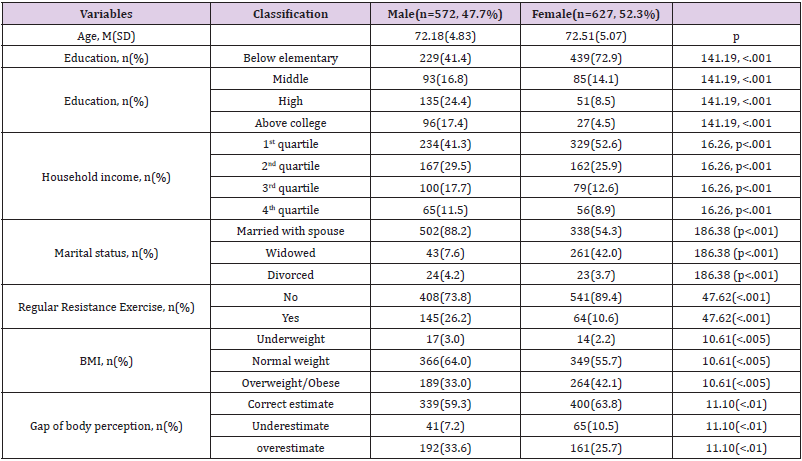
Table 1: Baseline characteristics of participants (n=1199).
Note: BMI: Body Mass Index.
In our subjects, 12.8% had sarcopenic HGS. Compared with participants with normal HGS, those with sarcopenic HGS were more likely to be older, be women, perceive themselves as underweight, be categorized by underweight based on BMI, be overestimated their weight, perform less regular resistance exercise, have lower household income, and be less educated (Table 2). Table 3 shows the associations between perceived weight misperception and sarcopenic Handgrip strength (HGS) according to adjustment levels of confounding factors. In fully controlled models, the odds of sarcopenic HGS tended to increase with underweight perception but tended to decrease with normal weight perception (ORs: 2.54, 95% C.I: 1.527-4.230). Compared with the Obese group by BMI categorization, the underweight group, BMI under 18.5, increased ORs 4 times of sarcopenic HGS. Compared with correct estimated weight status, underestimation and overestimation of weight status were high odds of sarcopenic HGS (ORs: 3.21, 95% CI: 1.230-8.381 and ORs: 3.954, 95% C.I: 1.479-10.542).
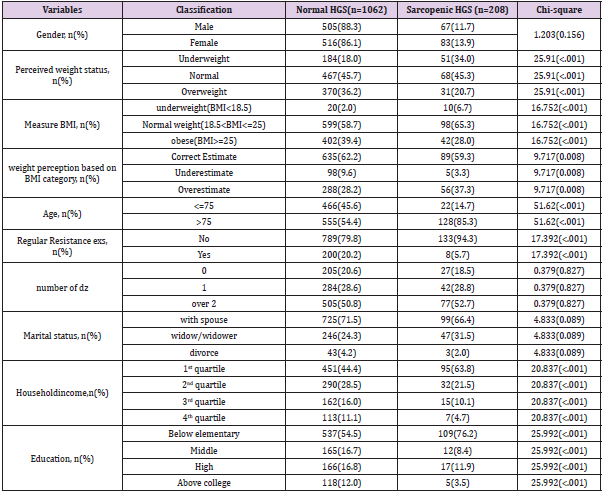
Table 2: Summarizes the comparison of the actual weight status, sociodemographic, health, lifestyle factors between an individual with normal and sarcopenic handgrip strength (HGS).
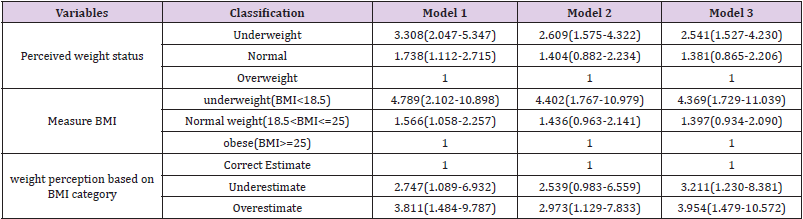
Table 3: Summarizes the comparison of the actual weight status, sociodemographic, health, lifestyle factors between an individual with normal and sarcopenic handgrip strength (HGS).
Note: Values represent Odd Ratio(ORs) (95% confidence interval) for sarcopenic handgrip strength using logistic regression after controlling for age and gender (model 1), for age, gender, education, household income, marital status (Model 2), for age, gender, education, household income, marital status, regular resistance exercise (Model 3) p for trend using linear regression analysis after adjusting for same confounding factors in each model.
Discussion
This study examined the association between body weight
misperception and handgrip strength in older adults, using extensive
nationally representative population data. Results showed that
underweight perception, objectively measured underweight status,
incorrect estimation of weight were associated with a higher risk
for sarcopenic HGS after controlling for sociodemographic factors
and health behavior. These findings were consistent across both
genders and weight statuses. According to the previous research
targeting the older population, weight tends to be underestimated
or overestimated[10]. Findings from a study of Japanese seniors
[11] reported that the increase in the risk for underestimation
was more obvious than that for overestimation in women, which is
comparable with our results that more elders overestimated their
body weight (29.4%) than underestimation (8.9%).
Given that women rarely overestimated their weight, the
overestimation found in our study may indicate an increasing rate of
attention toward healthy habits and lifestyles changes in the older
population. Because Korean National Health Insurance Services
provide medical exams every two years free of charge to make most
of the elder’s attention to their body shape and condition. This study
reported the association between weight misperception and low
grip strength in older adults. Although mechanisms for the results
are unclear, given that grip strength is critical for independent living
in later life, this result should be attending. One potential factor
could be obesity or sarcopenia. In a previous study, percent body fat
among older adults was associated with a higher volume of muscle
mass and muscle strength when examined knee extension strength
[12]. Therefore, seniors who believe their weight to be lighter or
heavier than their actual weight status affect their lifestyles such as
exercise and diet habits. Seniors who underestimate their weight
may be less motivated to make efforts to lose weight.
In contrast, elders who overestimate their weight may be less
motivated to make efforts to gain weight. This study (to the best
of our knowledge) reported the relationships of weigh-perception
with HGS based on a Nationally representative sample of older
Korean populations. However, this study has limitations such
as uncontrolled factors and potential causality, a possible bias
of measurement errors of HGS to generalize the results to other
populations. In conclusion, this study supports the hypothesis that
weight misperception and the accuracy of the perceived weight are
related to HGS. The results indicate that the programs for seniors
make them aware of their actual body weight and health education
for seniors to motivate them for healthy lifestyles based on their
body weight and disease status to keep their independent lives.
References
- Xue QL (2011) The frailty syndrome: definition and natural history. Clin Geriatr Med 27(1): 1-15.
- Bohannon RW (2019) Grip strength: an indispensable biomarker for older adults. Clinical interventions in aging 14: 1681-1691.
- Hong S (2019) Association of relative handgrip strength and metabolic syndrome in Korean older adults: Korea National Health and Nutrition Examination Survey VII-1. Journal of Obesity & Metabolic Syndrome 28(1): 53-60.
- Shaffer NC, Fabbri E, Ferrucci L, Shardell M, Simonsick E, et al. (2017) Muscle quality, strength, and lower extremity physical performance in the Baltimore Longitudinal Study of Aging. The Journal of frailty & aging 6(4): 183-187.
- Pieterse S, Manandhar M, Ismail S (2002) The association between nutritional status and handgrip strength in older Rwandan refugees. European journal of clinical nutrition 56(10): 933-939.
- Rantanen T, Masaki K, Foley D, Izmirlian G, White L, et al. (1998) Grip strength changes over 27 yr in Japanese-American men. Journal of Applied Physiology 85(6): 2047-2053.
- Lee K (2021) Weight underestimation and weight nonregulation behavior may be related to weak grip strength. Nutrition Research 87: 41-48.
- Cruz-Jentoft AJ, Bahat G, Bauer J, Boirie Y, Bruyere O, et al. (2019) Sarcopenia: revised European consensus on definition and diagnosis. Age and Ageing 48(1): 16-31.
- Korean Society for the Study of Obesity (2018). Obesity Practice Guideline 2018. Seoul: Korean Society for the Study of Obesity.
- Maukonen M, Männistö S, Tolonen H (2018) A comparison of measured versus self-reported anthropometrics for assessing obesity in adults: a literature review. Scandinavian journal of public health 46(5): 565-579.
- Yazawa A, Inoue Y, Kondo N, Miyaguni Y, Ojima T, et al. (2020) Accuracy of self‐reported weight, height and body mass index among older people in Japan. Geriatrics & Gerontology International 20(9): 803-810.
- Koster A, Ding D, Stenholm S, Caserotti P, Houston D, et al. (2011) Health ABC study, Does the amount of fat mass predict age-related loss of lean mass, muscle strength, and muscle quality in older adults? The Journals of Gerontology: Series A Volume 66(8): 888-895.
