 Short Communication
Abstract
The objective of this study is to determine whether confirmed COVID-19 cases in India would have reached 10 million. This study has compared α-Sutte indicator, Holt- Winters and, ARIMA to know the best effective method. Data for confirmed cases of COVID-19 was obtained from wordometer and database of Johns Hopkins University for the period started from 30 January 20120 (first confirmed COVID-19 case in India) to 06 December 2020. The data is divided into two categories: training data and test data. Training data was started from 30 January 2020 to 29 November 2020 for COVID- 19, and test data started from 30 November to 06 December 2020. To see the accuracy of each method, the comparison of the value of mean square absolute error (MAPE) and mean square error (MSE) is done. The MAPE value of 0.025 and MSE value 0.025 of α-Sutte indicator is smaller than MAPE and MSE of Holt-Winters and ARIMA methods. So, the α-Sutte indicator was found best method to predict the confirmed cases COVID-19 in India. The forecasting results that had been obtained were 10 million cases, namely from 15 to 17 December 2020: 9997704 (with interval 9974894-10020512), 10032937 (with interval 10008912-10056962), 10068171 (with interval 10042985-10093356). The α-Sutte indicator predicts that 10 million cases will be reported on 15 or 16 December 2020 in India situation report 42 by the WHO.
Keywords:α-Sutte Indicator; Short-Term Forecast; COVID-19
JEL Classification: G10, G15, C53, I12
Abbreviations: MSE: Mean Square Error; SEIR: Susceptible–Exposed–Infected– Recovered; T-LSTM: Time-Aware Long Short-Term Memory; NIPA: Network Inference- Based Prediction Algorithm; AHW: Additive Holt-Winters; MHW: Multiplicative Holt- Winters; TSLM: Time-Series Linear Model; MAPE: Mean Absolute Percentage Error
Short Communication
COVID-19 is an infectious disease caused by a new coronavirus (SARS-CoV-2), first reported in Wuhan, Hubei Province, China in December 2019 Yang, et al. [1]. In India, COVID-19 pandemic began to spread with a first confirmed case on 30 January 2020, which was originated from China Yang, et al. [1]. Currently, India has the largest number of COVID-19 confirmed cases in Asia, after the United States, it has second highest numbers of confirmed cases in the world with 9,735,975 of confirmed people with deaths 141,398 as at 01 PM on 09 December 2020 (IST). To anticipate the many confirmed cases of COVID-19, India began lockdown with a 14-hour voluntary public curfew on 22 March 2020 which was followed by mandatory lockdowns from 24 March 2020 (Government of India, 2020). To determine the COVID-19 confirmed case rate further in the future and to know the date when India will be reported 10 million COVID-19 confirmed cases, it is important to forecast the data with an efficient prediction model. COVID-19 forecasting is necessary to determine an overview of the increase in COVID-19 confirmed cases from time to time so that it can be taken into consideration in the decision-making process to control disease and stop transmission. Various researchers have studied forecasting related to COVID-19: Gatto, et al. [2] used Susceptible–Exposed–Infected–Recovered (SEIR) model in to predict COVID-19 transmission in Italy, Kuniya [3] also used the SEIR model to predict COVID-19 in Japan.
Das [4] used the SIR model to estimate the reproduction number of COVID-19 at national and state level in India. Li, et al. [5] proposed a temporal deep learning method, based on a time-aware long short-term memory (T-LSTM) neural network to predict COVID-19 for Wuhan, China. Deep Learning-based models are also used for predicting the number of novel coronavirus (COVID-19) positive reported cases for 32 states and union territories of India Arora [6]. A logistic model and machine learning based time series prediction model were used to the prediction of COVID-19 for global, Brazil, Russia, India, Peru, and Indonesia Wang [7]. Fong, et al. [8] has proposed GROOMs which ensembles five types of forecasting methods to predict pandemic like COVID-19. Singh, et al. [9] used ARIMA model for predicting the COVID-19 disease spread trajectories for the next two months. The epidemiologic of COVID-2019 is forecasted with the ARIMA in Indian states with a high daily incidence Roy [10]. Castillo [11] has described a hybrid intelligent approach for forecasting COVID-19 time series combining fractal theory and fuzzy logic. A paper used the Limited Failure Population concept to predict the SARS-CoV-2 virus for a number of European courtiers and the United States of America Koutsellis [12]. Singhal, et al. [13] used the mathematical model accounting and the Fourier decomposition method (FDM) to predict the COVID-19 cases in India, Italy, and the United State (US) Singhal, et al. [13].
Achterberg, et al. [14] used the Network Inference- based Prediction Algorithm (NIPA) to forecast the spread of COVID-19 in Hubei, China and Netherlands and he found that network-based forecasting is superior to any other forecasting algorithm. Widely used methods like ARIMA, Holt-Winters, alpha-sutte indicator, NNAR, Theta and suttARIMA have been used in this paper for forecasting modelling. Ahmar, et al. [15] has proposed sutteARIMA method to COVID-19 in the USA. Ahmar, et al. [16] used the sutteARIMA, a short-term forecasting method to predict COVID-19 and Stock market in Spain. Saleh [17] used the SutteARIMA model to predict COVID-19 confirmed cases in Spain. Comparison of ARIMA, Holt-Winters, SARIMA, and α-Sutte Indicator has been conducted by Ahmar, et al. [18]. This study has compared α-Sutte indicator, Holt-Winters and ARIMA models and compared which one is most efficient in predicting COVID-19 confirmed cases in India. Finally, the α-Sutte indicator was found most effective method to predict COVID-19 in India, and it was used to determine whether confirmed COVID-19 cases in India would have reached 10 million.
Literatures
ARIMA
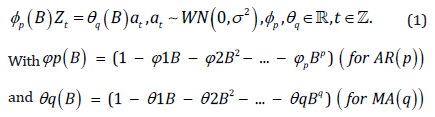
The (Zt) process is an autoregressive-moving average or ARMA (p,q) model if it fulfilled as (Wei,1994):
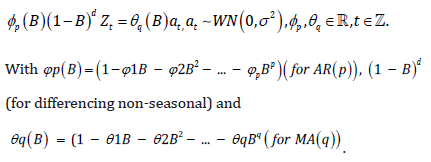
If there is a differencing then the ARIMA model becomes as follows:
α-Sutte Indicator
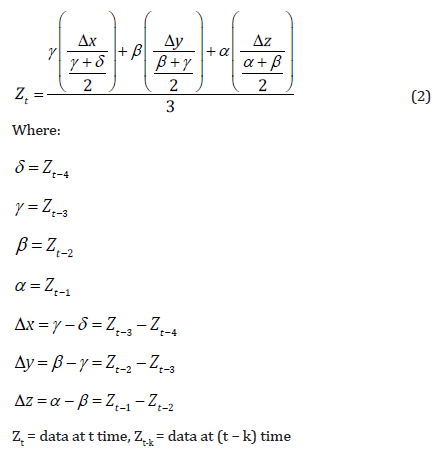
The α-Sutte indicator is based on the practice of forecasting that is developed on the previous values of the variable or data set Ahmar, et al. [19]. The model applies the adapted version of the MA (moving average) method of forecasting which is generally used to detect and forecast trends in time series data. The α-Sutte indicator’s predictions are based on four data sets of the previous period, i.e., Zt−1, Zt−2, Zt−3, and Zt−4 Ansari [19]. The principal equations of the indicator method are Ahmar, et al. [18].
Holt-Winters
Holt-Winters’s prediction method has been categorized into two part: Multiplicative Holt-Winters (MHW), and Additive Holt- Winters (AHW). The equation of MHW is described in the following equation (reference)
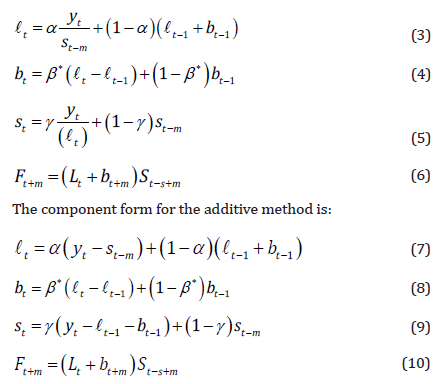
Where: yt = data on t time, s= the seasonal length in a certain time, and m=the amount of data to be predicated.
Method
Data was collected from World meter [20], CSSE, JHU [21] for 30 January to 06 December 2020. Training data was started from 30 January 2020 to 29 November 2020 and test data started from 30 November to 06 December 2020 for COVID-19. Tested data was used to test the accuracy of methods by using training data as reference data. Finally, on the basis of tested data, this study will determine whether confirmed COVID-19 cases in India would have reached 10 million. Ahmar [18] has developed suttee Forecast R package in R software which compares the forecasting results of other forecasting methods.
The Mean Absolute Percentage Error (MAPE) to test the accuracy level Kim [22,23].
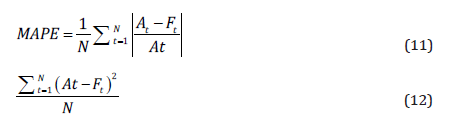
Where: At = Actual values at data time t and Ft=forecast value at data time t.
Results and Discussion
(Figure 1) shows that total COVID-19 confirmed cases have been an upward trend from the beginning. This trend indicates that 10 million cases will be completed in a short time period. This is also reinforced by (Figure 2), which explains that the average number of confirmed cases per day in India is around 35000 (in last five days). To further study the likelihood of succeeding the 10 million confirmed cases, it is necessary to forecast the data. In this study, the α-Sutte indicator method had an accuracy rate on data fitting of 0.025% for the period of 30 November 2020 to 06 December 2020. (Table 1) Finally, the α-Sutte indicator method is used to predict data (Table 2). The α-Sutte indicator predicts that 10 million cases will be reported on 15 or 16 December 2020 in India situation report 42 by the WHO (Figure 3).
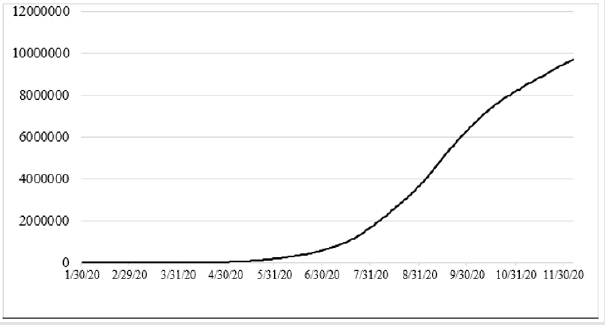
Figure 1: Confirmed Cases of Covid-19 in India (30 January 2020–06 December 2020).
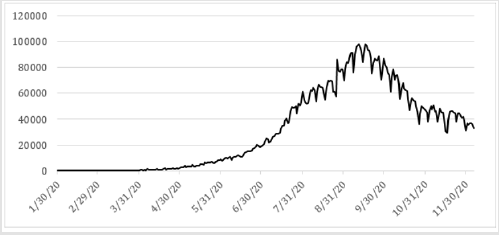
Figure 2: Daily New Cases of Covid-19 in India (30 January 2020–06 December 2020).
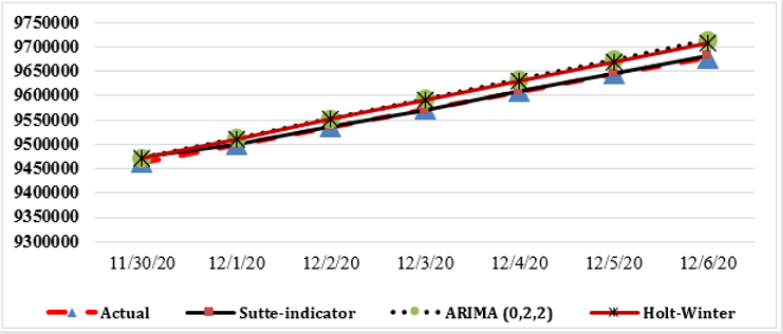
Figure 3: Fitting confirmed cases of COVID-19 in India.
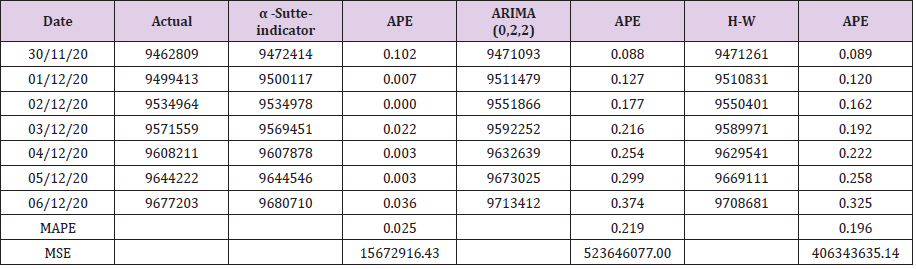
Table 1: Results of the fitting confirm cases of COVID-19 in India.
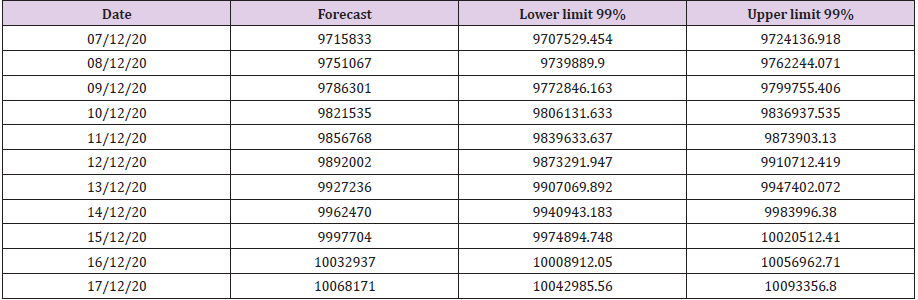
Table 2: The α-Sutte indicator forecasting 10 Million cases of COVID-19 in India.
Conclusion
In this study, the α-Sutte indicator had an accuracy rate on data fitting of 0.025%, which may be extended to 1%. The α-Sutte indicator method predicted that 10 million cases will be reported from the WHO in India situation report 42 on 15/16 December 2020. The COVID-19 confirmed cases on 15 to 17 December 2020 will be in the amount: 9997704 (with interval 9974894-10020512), 10032937 (with interval 10008912-10056962), 10068171 (with interval 10042985-10093356) in India (Table 2). The findings of this study are expected to provide input to the Government of India in order to be able to follow policies so that the spread of COVID-19 has not become serious since based on the results of the continued analysis of the α-Sutte process, if the addition of COVID-19 cases is stagnant, it is expected that by the end of December 2020 there will be about 10.5 million COVID-19 confirmed cases in India. For further research, this method can be compared with other methods, for example, Robust, NNAR, Theta, time-series linear model (TSLM) or other forecasting methods.
References
- Yang J, Zheng Y, Gou X, Pu K, Chen Z, et al. (2020) Prevalence of comorbidities and its effects in coronavirus disease 2019 patients: A systematic review and meta-analysis. International Journal of Infectious Diseases 94: 91-95.
- Gatto M, Bertuzzo E, Mari L, Miccoli S, Carraro L, et al. (2020) Spread and dynamics of the COVID-19 epidemic in Italy: Effects of emergency containment measures. Proceedings of the National Academy of Sciences of the United States of America 117(19): 10484-10491.
- Kuniya T (2020) Prediction of the Epidemic Peak of Coronavirus Disease in Japan, 2020. Journal of Clinical Medicine 9(3): 789.
- Das S (2020) Prediction of COVID-19 Disease Progression in India : Under the Effect of National Lockdown.
- Li L, Yang Z, Dang Z, Meng C, Huang J, et al. (2020) Propagation analysis and prediction of the COVID-19. Infectious Disease Modelling 5: 282-292.
- Arora P, Kumar H, Panigrahi BK (2020) Prediction and analysis of COVID-19 positive cases using deep learning models: A descriptive case study of India. Chaos, Solitons and Fractals 139: 110017.
- Wang P, Zheng X, Li J, Zhu B (2020) Prediction of epidemic trends in COVID-19 with logistic model and machine learning technics. Chaos, Solitons and Fractals 139: 110058.
- Fong SJ, Li G, Dey N, Gonzalez Crespo R, Herrera Viedma E (2020) Finding an Accurate Early Forecasting Model from Small Dataset: A Case of 2019-nCoV Novel Coronavirus Outbreak. International Journal of Interactive Multimedia and Artificial Intelligence 6(1): 132.
- Singh RK, Rani M, Bhagavathula AS, Sah R, Rodriguez Morales AJ, et al. (2020) Prediction of the COVID-19 Pandemic for the Top 15 Affected Countries: Advanced Autoregressive Integrated Moving Average (ARIMA) Model. JMIR Public Health and Surveillance 6(2): e19115.
- Roy S, Bhunia GS, Shit PK (2020) Spatial prediction of COVID-19 epidemic using ARIMA techniques in India. Modeling Earth Systems and Environment, 1-7.
- Castillo O, Melin P (2020) Forecasting of COVID-19 time series for countries in the world based on a hybrid approach combining the fractal dimension and fuzzy logic. Chaos, Solitons & Fractals 140: 110242.
- Koutsellis T, Nikas A (2020) A predictive model and country risk assessment for COVID-19: An application of the Limited Failure Population concept Chaos, Solitons Fractals 140: 110242.
- Singhal A, Singh P, Lall B, Joshi SD (2020) Modeling and prediction of COVID-19 pandemic using Gaussian mixture model. Chaos, Solitons and Fractals 138: 110023.
- Achterberg MA, Prasse B, Ma L, Trajanovski S, Kitsak M, et al. (2020) Comparing the accuracy of several network-based COVID-19 prediction algorithms. International Journal of Forecasting.
- Ahmar A, Boi E (2020) Current Research in Behavioral Sciences Will COVID-19 confirmed cases in the USA reach 3 million? A forecasting approach by using SutteARIMA Method. Current Research in Behavioral Sciences.
- Ahmar Ansari Saleh, Del Val EB (2020) SutteARIMA: Short-term forecasting method, a case: Covid-19 and stock market in Spain. Science of the Total Environment 729: 138883.
- Saleh A, Boj E (2020) The date predicted 200. 000 cases of Covid-19 in Spain. Journal of Applied Science, Engineering, Technology and Education 2(2): 0-5.
- Ahmar AS, Rahman A, Mulbar U (2018) α-Sutte Indicator: A new method for time series forecasting. Journal of Physics: Conference Series 1040(1): 012018.
- Ahmar Ansari Saleh (2018) RcmdrPlugin.sutteForecastR : An RcmdrPlugin for Forecasting Data. Journal of Physics: Conference Series 1028(1).
- (2020) World meter Coronavirus Cases.
- JHU (2020) Novel Coronavirus 2019 time series data on cases.
- Kim S, Kim H (2016) A new metric of absolute percentage error for intermittent demand forecasts. International Journal of Forecasting 32(3): 669-679.
- William WS Wei, Steven C Hillmer (2014) Time Series Analysis : Univariate and Multivariate Methods. Published by American Statistical Association Stable. Your use of the JSTOR archive indicates y 86(413): 245-246.
