 Short Communication
Abstract
Currently there is a contradiction between availability of various new equipment, which provides a stream of digital video data, in particular in the form of point clouds from mobile laser scanning, and the lack of adequate efficient methods of information extraction and analysis. This project is aimed at resolving this contradiction on the basis of neural modeling field theory and dynamic logic (DL) proposed by L. I. Perlovsky. The main result of the project will be a method of extracting information from digital video data in the form of hybrid clouds of mobile laser scanning data points for their analysis based on neural modeling field theory and DL. The success of this project depends on the successful integration of approaches from various fields of science and technology (interdisciplinarity): artificial intelligence, pattern and object recognition, logic, algorithm theory. The significance of the development of the proposed method is to create a fundamental theoretical basis for new application algorithms and software in the field of autonomous driving, “smart city” projects, ensuring safety for sites of various purposes, etc. The scientific novelty of the proposed method is that it will solve, by a fairly new method, the relevant problem of extracting and analyzing information from a not particularly traditional type of digital video data represented by a hybrid cloud of laser scanning points. This will allow to significantly expand the existing boundaries of knowledge in the field of extraction and analysis of information from various digital video data. The main hypothesis of the research is that the new method based on L. I. Perlovsky’s neural modeling field theory and DL will improve the performance of relevant calculations and close the existing gaps in the use of various digital video data.
Abbreviation: AI: Artificial Intelligence; NMF: Neural Modeling Fields; DL: Dynamic Logic; CC: Combinatorial Complexity; LIDAR: Light Identification Detection and Ranging
Short Communication
Digital image and video processing are one of the most
resource-intensive tasks and at the same time -important and
relevant, closely related to the problem of artificial intelligence (AI)
and modeling of cognition. Its frequent combinatorial complexity
complicates the already difficult task: partition and recognize
-partition video data (video image) into meaningful objects and
recognize their essence, classify them. Mathematical logic offers
to solve recognition problems by iterating over all known images
and comparing them with the presented one. Even with a modestly
sized set of options, the number of combinations to compare would
be huge. At the same time, there are many separate methods and
concepts in this field, often used together: decision trees, support
vector method, convolutional neural networks, deep learning,
K-means, latent Dirichlet allocation, etc.
L. I. Perlovsky has developed an original approach to cognition
modeling based on the theory of neural modeling fields (NMF) and
dynamic logic (DL) [1-3] that we propose for analyzing various
digital video data. While ordinary logic operates with precise
statements like “this is a chair”, DL is a vague-to-crisp process.
DL implements the causal principle of cognition, including object
recognition: at each moment the state of the NMF is determined
by the previous state. This approach, on one hand, is based on a
detailed analysis of the problems of cognition modeling in AI (the
shortcomings of formal logic; combinatorial complexity (CC))
and, on the other hand, on data from psychology, philosophy
and cognitive science about the basic mechanisms of cognition.
Perlovsky’s analysis of problems in cognition modeling actually
has a greater significance, and the overcoming of these problems can lead to new formalizations of the cognition process. Thus in
[4] a generalization of the theory of NMF and DL is obtained in the
form of phenomena and cognition DL. These logical systems are
formulated in the most general terms: the relationship of generality,
uncertainty, simplicity; the problem of maximizing similarity with
empirical content; the learning method. Perlovsky L. I. notes that
presently available neural networks are too simple to explain
human cognition, and the NMF seek not only to improve methods
for solving practical problems, but also to take a step towards
explaining cognition.
The structure of NMF corresponds to our knowledge of the
neural organization of the brain. The versatility of cognition and
the wonder of the human brain are explained in part by dynamic
logic. With standard Aristotelian (exact/”crisp”) logic we encounter
a lack of adaptability and a combinatorial explosion/complexity of
computation (in particular, the “curse of dimensionality” as well).
Logic, according to Aristotle, is a tool for expressing previously made
decisions, not a mechanism of cognition, i.e. making new decisions.
It is this multifaceted mechanism of NMF/DL and its underlying
theory that we propose to be applied to various tasks related to the
processing and extraction of information from various digital video
data. The following is an overview of current research in the field of
intelligent methods of extracting information from various digital
video data with an analysis of the problems faced by researchers.
At the same time, to even more clearly determine the relevance of
the proposed method for the development of solutions to current
problems, we present the prospects of using the method based on
the NMF/DL to solve such problems.
Thus, [5] describes the different methods used in biometrics
and lists the works with indication of used methods, features,
and data sources. Among the open problems mentioned in [5] are
statistical modeling and mathematical analysis of “soft” biometrics,
including the processing of big data (for example, over 1.2 billion
subjects in the Indian project UIDAI) and improving the accuracy
and performance of such an algorithm. It is in fact the NMF/DL
method that is capable of working quickly with big data without
losing accuracy. In addition, it allows one to create statistical models.
Work [6] addresses the problem of recognition of road signs and
presents a table of works with indication of used methods, signs,
and an assessment of recognition success, as well as the authors’
own methods. This topic is an important part of one of the most
important challenges of the 21st century: autonomous driving. The
topic is also important for the inventory of signs on the country’s
roads and the tracking of their condition [6-8]. As with biometrics,
there are certain obstacles to effective recognition: sign variability,
lighting, shadow, orientation, etc. The authors of [6] work with a
test base of 11000 signs. The NMF/DL method, should it have a
dozen such bases, could help solve the problem of processing in an
acceptable timeframe, and this would increase the accuracy along
with performance.
Moreover, part of the task of autonomous driving is
simultaneous detection of a sign in real time (and other objects:
pedestrians, other cars, trees, traffic lights, etc.), its recognition,
tracking, combining new information with information about all
objects and information from all other sensors of the car, and finally,
on the basis of all this, to give the car appropriate instructions. In
addition to the large amount of data as such, the difficulty lies in the
fact that all of this data must be linked together. The “associative”
aspect of the NMF/DL method will solve this problem. A close
cousin of autonomous driving is UAV (unmanned aerial vehicles)
autonomous flight, for which it is also important to quickly
recognize objects and landscape and make decisions. In addition to
military applications, UAVs are also useful for scanning cities from
a height to create their 3D models. In [7] the authors deal with this
latter topic and write that LIDAR (Light Identification Detection
and Ranging) is in demand because of the possibility of obtaining
digital video data of high density and high image accuracy. At the
same time, breakthroughs in the development of sensor technology,
primarily laser, and of their corresponding algorithms allow us to
efficiently and accurately build models based only on 2D images
from cameras (including consumer-class) attached to the UAV.
The DL algorithm is able to solve both problems (LIDAR and 2D
images from cameras). Then it would be possible to compare the
accuracy of the two approaches, and, in the case of a clear victory
for LIDAR, use LIDAR instead of cameras, as DL will allow to do
so effectively, despite the high volume of data. In [7] the authors
point to the instability of existing UAVs, which results in images
being blurred and poorly structured. The “associative” aspect of
the NMF/DL method will solve this problem as well. In addition
to photo and video recording of road signs and entire cities, civil
and military engineers also record roadways, buildings, factories,
bridges and other infrastructure to monitor their condition and
identify defects: cracks, breakdowns, vibrations, etc. Photo and
video recording allow to more massively monitor the condition of
objects, as well as to avoid risking lives of climbers who have to
climb bridges, tall buildings, etc. Scientists have developed many
approaches to the processing of such digital video data. A detailed
review of the approaches is given in [8]: convolutional neural
networks, deep learning, etc. Work [8] also describes the difficulties
and challenges for scientists in this field, including the fact that a
person still copes with the task of recognizing objects better than
a computer program, thanks to knowledge of the situation context,
correct identification of a structure’s damaged part, knowledge
of its importance in the design, etc. We propose linking all these
aspects together using the NMF/DL method.
While [5] addresses biometric markers of the body such as the
face, moles and tattoos, in [9] the authors cite their own method of
processing the face in the context of medico-emotional well-being
based on principal component analysis, a deep belief network
and local direction-based robust features. Article [10] proposes a method, and article [11] an overview of the topic of recognizing
abnormal crowd behavior. Such technology can help the police to
recognize upcoming riots on city streets. Article [12] considers
the recognition of human actions and suggests methods. This
technology will be useful in airports and railway stations, where it is
necessary to track individual actions of various individuals, and not
the whole crowd. It will also find use in medicine and sports. The
NMF/DL method has great prospects in improving the efficiency
of solving such problems. The huge volume of unstructured video
data from a plethora of cameras at railway stations and airports
requires a radically new approach to their processing. This issue
is touched upon in [13]. The NMF/DL method can potentially cope
with this due to its performance. In [14] the issue of extraction of
useful information from various data of past floods is discussed. In
[15] the authors propose a way to significantly reduce the amount
of data: to extract planes from it, since buildings and many objects
often consist of them. In addition to planes, other features can be
extracted; more on this in [16]. Work [17] develops a method for
extracting text from video.
As stated in all aforementioned publications, any digital photo
and video data typically contain different kinds of noise and clutter:
leaves on the road, raindrops on a street sign, dust in the air,
reflections, etc. In the NMF/DL method it is possible to specify a
noise/clutter model which would take upon itself the corresponding
noise points, such that the remainder of the points can be “cleanly”
associated with the main models. Works [18-20] present the results
of the development of methods and algorithms for processing laser
scan and photography hybrid data. It is concluded that mobile laser
scanning data is very promising from a practical point-of-view. At
the same time, this type of laser scanning produces results in the
form of a stream of inherently heterogeneous digital video data.
However, there are practical difficulties in finding solutions for this
kind of real (rather than test) video data of huge size. This requires
the development of fundamentally new methods of processing and
analysis of this type of video data. Therefore, for the study of possible
applications we chose a model of neural model fields, proposed and
constructed by Perlovsky L.I., which allows to overcome the “curse
of dimensionality” in recognition problems and interpreting a
number of features of thought processes important for the analysis
of video data [1,21].
Methods and Materials
Data from several sources were used. Outside scans of a European village were obtained from Semantic3D (bildstein_ station1_xyz_intensity_rgb). Inside scans of an office space were obtained from ISPRS’s case study #5. Our own scans of geometric blocks were used as well. Calculations were performed in MATLAB R2018a on a 64-bit Windows 10 Pro with 64 GB RAM, an 8-core Intel Xeon E5 CPU and an NVIDIA Quadro P6000 GPU. Most heavy-duty calculations were performed on the GPU. The algorithm was written in accordance to DL (dynamic logic) developed by L. I. Perlovsky [1-3]. We used the clustering-specific version (also developed by Perlovsky) as opposed to the general one. The following Gaussian likelihood measure for conditional similarities was used:
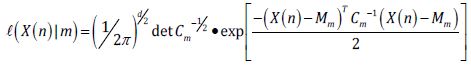
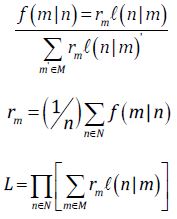
where X(n) is the input at data point n, Cm are the covariance matrices for models (i.e. clusters) m = 1,...,М and Mm is the model center expressed in the coordinates of X(n) . The data point X(n) is generally in the form of a vector consisting of 3D spatial coordinates plus, optionally, intensity or color (RGB) or both. Model centers are initialized to randomly fall within the point cloud’s boundary box and not too close to the boundary. Covariances are initialized random and large -on the order of the whole point cloud’s size. Association variables, model rates (priors) and similarity measure, respectively, are given by
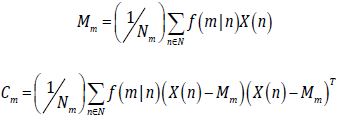
General DL equations for models and parameters are replaced by more clustering-specific equations (also given by Perlovsky):
A mechanism has been developed for putting superfluous and redundant models to sleep and, on the other hand, waking up / creating new models when more are needed. So far it has not given entirely satisfactory results and is hence not used. In the future it may be useful to use it to automate the amount of models M used instead of presetting the number upon initialization. Initially, the algorithm was used in one go, with the amount of models M set at numbers like 25 or 60. Later, a method giving much better results was found: if one wants, say, M=25 clusters, then initially the entire point cloud is broken down into 5 clusters, and then each of the original 5 clusters is broken down further into 5 clusters each, resulting in 25 clusters. In the end, it means each point in the cloud will have been clustered twice by two separate instances of the DL algorithm. This method (we call it “5x5”) not only gives much more sound results, but also ends up in faster calculation time. It also allows for much larger data sets and many more models M to be assigned, since in the 1st computation instance the computer has to handle 5x less models compared to the “in one go” method, and in the 2nd instance, in addition to handling 5x less models, it also handles 5x less input data in each computational branch of the instance.
Results and Discussion
Our experiment focuses on clustering in just the 3 spatial coordinates because color and intensity from a laser scan can have too great a negative influence on the final clustering. A demonstration of this is below in (Figure 1). For the original shots we use a color scale for the intensity parameter (not for RGB color). The coloring in the resulting shot shows clustering (i.e. each color corresponds to its own cluster). As seen, intensity of a point depends a lot on angle of incidence, which is useful for discerning a façade from a roof, but is bad when a façade wall is round, or in the case of the car door, where the lower and upper halves, which are at slightly different angles, give off different intensities of the reflected laser beam. The clustering that results when intensity differences are carried over into the models is unsatisfactory. It also appears that reflected beam intensity depends on the material the beam hits, as seen on the car wheels: the rubber tire has one intensity, while the metal hub has a different intensity. This does not result in a meaningful clustering.
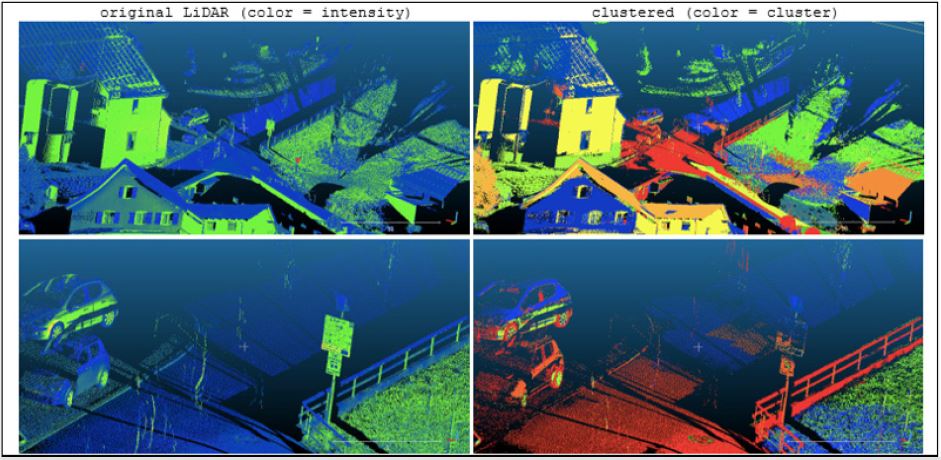
Figure 1.
Furthermore, we can see that where different intensities are
mixed together chaotically, as they are on the field, the algorithm
has given a similarly noisy intertwining of clusters. This may find
use (in conjunction with the aforementioned dependency on the
material of an object) in a crop field, where different types of crops
must be differentiated from each other or from parasites or from
the ground, but we have not performed such testing here, instead
focusing on objects of infrastructure. It may make sense, however,
to try such testing. Hence, as mentioned, we mostly continue
applying our clustering algorithm to only the 3 spatial dimensions.
The main objective is to break down an enormous point cloud
into useful subsets. After that, it is entirely possible to run further
instances of the algorithm on the obtained clustering result in more
than just the 3 spatial dimensions, i.e. include color or intensity if it
would seem to give a better result, or to altogether run a different
type of algorithm on these subsets, such as one of object/pattern
recognition.
In (Figure 2) below we demonstrate results of clustering the
European village scan from Semantic3D into 25 clusters plus 1
noise cluster using the 5x5 method described in “Methods and
materials”, and compare it to the original “25 clusters (plus 1 noise
cluster) in 1 instance” method. Noise cluster is always colored
light gray. Several successes and mishaps can be seen. The bottom
screenshot, when compared to the 1st one, shows that the 5x5
method generally results in a slightly sounder clustering, mainly
manifested in objects not being broken up into random pieces as
often. On the other hand, even in the final screenshot we still see
parts of trees and buildings clustered together. Furthermore, we see
one such cluster neighboring another such cluster containing parts
of the same trees and buildings, and these 2 clusters are split by
an approximately horizontal plane for no apparent reason. Granted,
the algorithm is only one of clustering and not classification, hence
it is not, in its bare form, smart enough to discern between objects.
It is important to mention the enormous effect that the
positioning of the LiDAR scanner has on the clustering. In the final
screenshot in (Figure 2) we see a green cluster in the middle - a
roughly round patch of ground, no different than the ground around
it. In the middle of it is where the LiDAR scanner was positioned. Hence, nearby it there is a much higher density of points than
further away. The difference in density within the image has a large
effect on the final result, since cluster weights depend on the relative
number of points in them. This is why we see an accumulation
of small-volume clusters near the scanner position, with largervolume
clusters farther away from the scanner. To resolve this, a
density readjustment subfunction could be implemented within
the algorithm, or, alternatively, an initial down sampling (or a
voxeling) could be performed in input data pre-processing before
implementing DL. Also, if done correctly, working simultaneously
on several scans from different positions could improve the result.
Of the aforementioned, down sampling was tried, as was removing
the ground, as well as a combination of these two approaches.
Surprisingly, none of these methods gave better results, though
down sampling helped reduce the concentration of small-volume,
high-density clusters near the scanner position.
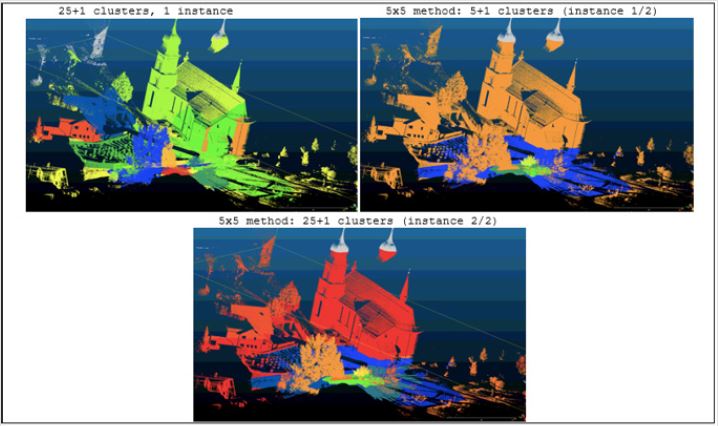
Figure 2.
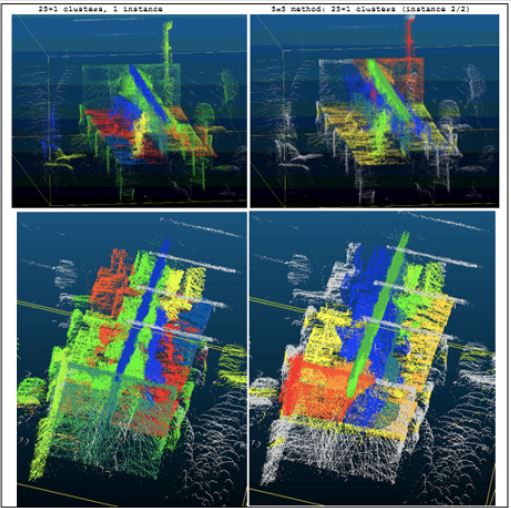
Figure 3.
Also, since the algorithm involves gradient ascent, it is possible that the algorithm stops at a local maximum instead of a global one, though this is generally avoided by the vague-to-crisp aspect of the DL algorithm. Nonetheless, we tested this phenomenon by running the algorithm 50 times with randomly initiated cluster centers each time and picking the result with the greatest value of the likelihood function. This did not lead to a noticeably better result. Our DL algorithm was also tested on a subset (1 room) of ISPRS data (Case Study 5). The LiDAR data did not include an RGB reading -only intensity, which we ignored. Below in (Figure 3) we demonstrate the results from 2 different POVs and using the same 2 methods as before. As before, noise is colored gray. The most striking thing about these results is how well the tabletops and several other entities are separated from other objects, even if the tabletops themselves are split into several clusters. A clearer demonstration of this is below in (Figure 4) from different POVs. For clarity, the tabletops have been gathered into one cluster and recolored orange. The same is done with the top of the divider between tables (green). Bounding boxes are drawn for each of these 2 entities to show how flat/long they are. These 2 entities are displayed separately from everything else. The “everything else” is displayed in separate images from several POVs and maintains its original coloring (clutter points are excluded altogether).
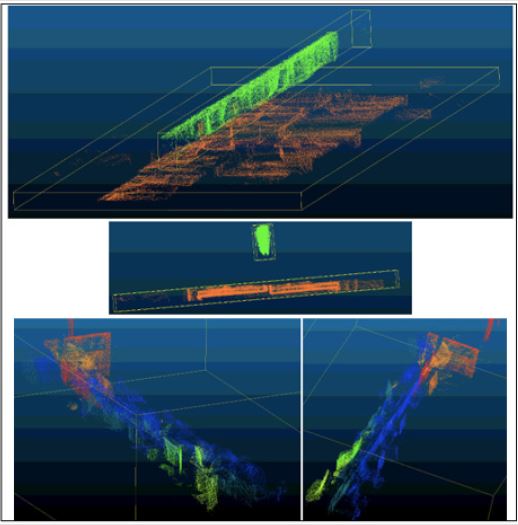
Figure 4.
The “everything else” is clustered well in some ways, worse in
others. The dark-orange vertical divider at the very end of the table
is well-separated, though a large part of it is included in the lightorange
cluster, which includes other things among it. The green/
yellow objects are actually several clusters that manage to fairly
decently separate computer monitors. However, the blue and bluegrey
clusters are a bit nonsensical. They go from one side of the
long table divider to the other, i.e. are a bit skewed. Compared to
the clustering of the outside scan (Bildstein), the indoor data seems
to cluster better under our DL algorithm. Indeed, we see a better
separation of objects and don’t see as much chaotic splitting and
overlapping, such as when half a tree would be clustered together
with half a building, and the other halves of these objects would
be in a 2nd cluster. And though a tabletop, for example, may be split
between 4 different clusters, it is trivial to join these clusters up into
1 due to the aforementioned separation of objects. A demonstration
of this joining of clusters was already presented above.
Quick computation time (relative to other methods) is a big
advantage of using DL. For example, with the Bildstein file, which
contains about 29.7 million points, if we cluster over the 3 spatial
dimensions, set the number of models (clusters) to M=25 plus 1 noise model, then on our computer we achieve a computation time
of just 34 seconds per 1 iteration of the main loop in the algorithm.
Generally, in 10-20 iterations of this main loop a decent result can
be achieved, but 40-50 are recommended. Similarly, if we use the
5x5 method with a limit of 40 iterations per branch/instance, i.e. we
break down the cloud into 5 clusters (plus noise) in 40 iterations,
then additionally break up each of the 5 resulting clusters into 5
more clusters each in 40 iterations, this takes 512 seconds on our
computer, which, divided by 40, gives us just 12.8 seconds, which
is 2.7x faster than the 34 seconds in the 1st method (1 instance,
M=25+1). If we cut this time down in half by halving the number
of iterations, then we encounter a loss of 4% in the shifted loglikelihood.
DL theory dictates that the computation time of DL is linear in the number of points, clusters and parameters, while in fact the results we achieved seemed to be better: DL is sublinear in all three. This may be attributable to the use of a GPU, as generally without a GPU (using standard RAM) the computation time was linear in the number of points, clusters and parameters. In fact, it is possible that calculation time with a GPU is sublinear up to a certain number of points/clusters/parameters, after which it approaches an asymptote, i.e. is linear, but this is not possible to test rigorously, since the GPU would have to be used in several full capacities.
Conclusion
This article describes the results of applying our DL-based
clustering algorithm to LIDAR scans of a village street and inside
an office space. The DL algorithm is able to work quickly with
millions of points. All results presented here concern clustering in 3
spatial coordinates, i.e. ignoring the interfering color and intensity
parameters, though these parameters can be useful in other cases,
for example, in scans of agricultural fields. We use 2 clustering
methods: in the first, segmentation is carried out simultaneously
for 25 models (plus noise) in 1 instance (run) of the algorithm; the
second (the so-called “5x5 method”) also clusters into 25 models
(plus noise); however, it does so in 2 consecutive instances of the
algorithm, where the 1st run performs an initial segmentation into
5 clusters (plus noise), and in the 2nd -each of the 5 initial nonnoise
clusters is divided into a further 5. The “5x5” method with
the original Bildstein image allows clustering to be performed
2.7 times faster (29.7 million points in about 8 minutes), and the
result is not worse than the one obtained by the 1st (basic) method.
Reducing the number of iterations (and therefore the calculation
time) by half reduces the shifted log-likelihood by 4%.
The best results are obtained when clustering the office space
scan (ISPRS). The high-quality segmentation of the countertop
and dividers stands out particularly. In the case of the village scan,
we see satisfactory results. DL-clustering divides the space both
into clusters that make sense and those that make less sense.
To improve the result, we tried down sampling, removing the ground, and a combination of these two approaches. However, no
improvement is thence shown. We also consider the possibility that
the algorithm reaches a non-global local maximum in its gradient
ascent; however, these doubts are refuted with high certainty: we
ran the algorithm 50 times with arbitrary initializations, and all
results gave approximately the same final likelihood.
References
- Perlovsky LI (2006) Toward physics of the mind: Neural modeling field theory. Neuroinformatic 1(2): 175-196.
- Perlovsky LI (2006) Toward physics of the mind: Concepts emotions consciousness and symbols. Physics of Life Reviews 3(1): 23-55.
- Perlovsky LI (2007) Neural networks fuzzy models and dynamic logic. Studies in Fuzziness and Soft Computing 209(3): 363-386.
- Kovalerchuk B, Perlovsky L (2008) Dynamic logic of phenomena and cognition. IEEE pp. 3530-3537.
- Dantcheva A, Elia P, Ross A (2015) What else does your biometric data reveal? A survey on soft biometrics. IEEE Transactions on Information Forensics and Security 11(3): 441-467.
- Balali V, Golparvar Fard M (2016) Evaluation of multiclass traffic sign detection and classification methods for US roadway asset inventory management. Journal of Computing in Civil Engineering 30(2): 04015022.
- Rothermel M (2014) Fast and robust generation of semantic urban terrain models from UAV video streams. 2014 22nd International Conference on Pattern Recognition pp. 592-597.
- Spencer Jr BF, Hoskere V, Narazaki Y (2019) Advances in Computer Vision-Based Civil Infrastructure Inspection and Monitoring. Engineering 5: 199-222.
- Uddin Z, Hassan M, Almogren A, Alamri A, Alrubaian M, et al. (2017) Facial expression recognition utilizing local direction based robust features and deep belief network. IEEE Access 5: 4525-4536.
- Wang B, Ye M, Li X, Zhao F (2011) Abnormal crowd behavior detection using size adapted spatio temporal features. International Journal of Control Automation and Systems 9: 905.
- Sreenu G, Durai MAS (2019) Intelligent video surveillance: a review through deep learning techniques for crowd analysis. Journal of Big Data 6: 1.
- Chou MK, Prasad M, Wu D, Sharma N, Li DL, et al. (2018) Robust feature based automated multi view human action recognition system. IEEE Access 6: 15283-15296.
- Gharbi H, Bahroun S, Zagrouba E (2018) Key frame extraction for video summarization using local description and repeatability graph clustering. Signal Image and Video Processing 13(3): 507-515.
- Macchione F, Costabile P, Costanzo C, De Lorenzo G (2019) Extracting quantitative data from non-conventional information for the hydraulic reconstruction of past urban flood events. A case-study. Journal of Hydrology 576: 443-465.
- Zhang G, Vela P, Karasev P, Brilakis I (2015) A sparsity‐inducing optimization-based algorithm for planar patches extraction from noisy point cloud data. Computer‐Aided Civil and Infrastructure Engineering 30(2): 85-102.
- Jimenez M (2018) Summarization of video from Feature Extraction Method using Image Processing and Artificial Intelligence.
- Wong EK, Chen M (2003) A new robust algorithm for video text extraction. Pattern Recognition 36(6): 1397-1406.
- Badenko V, Tammsaar S, Beliaevskii K, Fedotov A, Vinogradov K, et al. (2019) Multithreading in Laser Scanning Data Processing. Lecture Notes in Computer Science 11619: 289-305.
- Badenko V, Fedotov A, Vinogradov K (2018) Algorithms of laser scanner data processing for ground surface reconstruction. Lecture Notes in Computer Science 10961: 397-411.
- Fateeva E, Badenko V, Fedotov A, Kochetkov I (2018) System analysis of the quality of meshes in HBIM. MATEC Web of Conferences 170: 03033.
- Perlovsky LI (2017) Physics of the mind dynamic logic and monotone Boolean functions. Studies in Computational Intelligence 683: 193-231.
