info@biomedres.us
+1 (502) 904-2126
One Westbrook Corporate Center, Suite 300, Westchester, IL 60154, USA
Site Map

Received: January 04, 2018; Published: January 12, 2018
*Corresponding author: Wang Shouming, College of Horticulture, Shenyang Agricultural University, Shenyang 110866, China
DOI: 10.26717/BJSTR.2018.02.000657
The strains of wild Inonotus obliquus were used as the materials. An improved CTAB method of Inonotus obliquus DNA extraction was applied to obtaining genomic DNA. And it was used for template then to optimize RAPD amplification conditions. The results indicated that: a volume of 25 μL was used which contained 40ng/μl template DNA, 10pmol primer, 2mmol/L Mg2+, 1.0 unit domestic Taq DNA polymerase, 100μmol/L dNTP, others complement with ddH2O. The amplification program was that 1 cycle of 5 minutes at 94oC to initial denature; 45 cycles of 1 minute at 94oC to denature, 1 minute at 40oC for annealing, 1.5 minutes at 72oC for extension; 5 minutes at 72oC for final extension.
Keywords: Amplification; Fungus; Mycelium; Primer Screening
Abbreviations: RAPD: Random Amplification of Polymorphic DNA; PDA: Potato Dextrose Agar
Inonotus obliquus (Pers.:Fr.) J. Schroet. is a rare and one of the world’s top ten medicinal fungus assigned to the family Hymenochaetaceae that has been used in Russia and other European Slavic countries as a traditional folk medicine to treat gastrointestinal disorders and various cancers. According to the report, triterpene compound and steroids that its effective ingredients have the effect of preventing cancer metastasis and relapse, enhancing immunity, improving blood circulation, adjusting blood pressure and reducing the cholesterol. Its sclerotium to diabetes cure rate can reach more than 93% [1-5]. It is a parasitic fungus growing on birch, alder, beech and other hardwood trees throughout North America and Europe. It was seldom formed fruit-body, which has not obvious exterior characteristic and be tumor shape. So it is difficult to study about the relationship of Inonotus obliquus [6-9]. RAPD analysis was chosen instead of restriction fragment length polymorphism or minisatellite DNA analysis, because RAPD can be performed without any previous knowledge of specific DNA sequences of the species under study. RAPD requires small amounts of DNA and it is faster, less costly, and less labour-intensive than the other two DNA techniques [10-12]. However, RAPD analysis required strict conditions. And it is necessary to optimize amplification conditions and program in advance, so as to make RAPD bands stable and is repeated. Therefore, this paper will discuss concentration of template DNA, primer, Mg2+, dNTPs, TaqDNA polymerase and reaction procedures in order to establish a simple, quick, economic and practical optimization procedure and method.
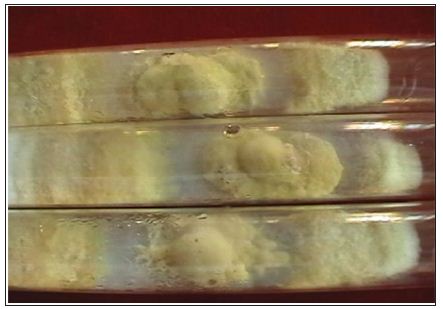
Mycelium of eight Inonotus obliquus samples are MAFF 420243, MAFF 420101, MAFF 420279, MAFF 420102, ATCC 28281, MAFF 420100, NBRC9788, NBRC8681. Specimens were deposited in the Microbiological Genebank, National Institute of Agrobiological Sciences (NIAS), Japan, and the Biological Resource Center, National Institute of Technology and Evaluation (NITE) and American Type Culture Collection (ATCC). Materials were isolated using potato dextrose agar (PDA) medium and maintained at College of Horticulture Shenyang Agricultural University (Figures 1 & 2).
Figure 1: Wild sclerotia of Inonotus obliquus.
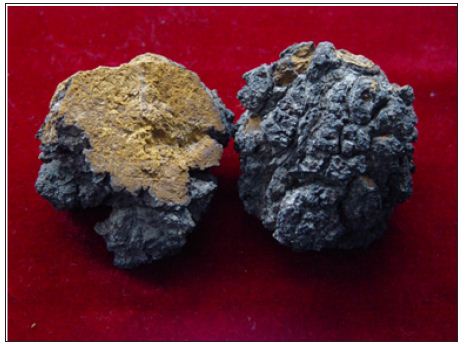
Figure 2: Pure cultured strains of Inonotus obliquus.
Reagent: TaqDNA polymerase 3unit/μL, 10 bases random primer H-07 (5’-CTGC A TCGTG-3’); 10×Buffer contained 500mM KCl, 100mMTris-HCl, 1.0﹪Triton X-100; 25mM MgCl2; four kinds dNTPs (dATP,dTTP,dCTP,dGTP) of 100mM. The entire reagent was provided by Sino-American Biotechnology Company in Beijing, China.
HERMLE2383 Low Temperature Centrifuge, Hitachi U-3010 Spectrometer, DB80240-33 PCR, GDS-8000 gel documentation systems, the Ultra-low temperature freezer (-86oC), 2~5000μl micropipette components and suction head, DYY-III electrophoresis and all kinds of electro deposition bath.
Genomic DNA was extracted from fungal mycelium using the cationic detergent cetyltrimethylammonium bromide (CTAB) method and this method has been improved. Samples were diluted 20-fold with TE buffer, and the OD values at 260, 280 and 230 nm were determined in triplicate (Hitachi U-3010 Spectrophotometer). DNA purity was calculated from the OD 260 / OD 280 value, and the concentration of the original DNA solution using [C (ng/μL) = OD260×50×dilution ratio]. Samples were diluted to 10-100 ng/μL with TE buffer. The quality of the DNA samples was determined by electrophoresis (0.5×TBE buffer, 60V for 30 min) on 0.7% (w/v) agarose gels containing 0.5 μg/mL ethidium bromide. The best DNA of strains were selected and stored at -20oC prior to use [13-16].
Primers, which were used, were selected from a total of 100 random primers found to be effective in generating amplification products.
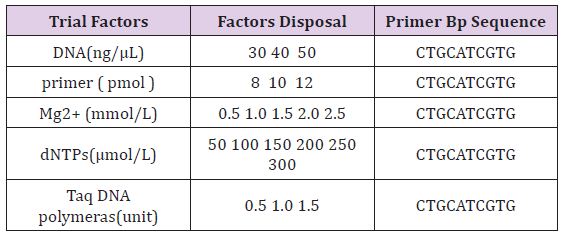
a. Reaction Conditions Optimization: In other factors remain unchanged, a single factor was changed according to certain gradient and adjusted ddH2O quantity accordingly to keep reaction system for 25 μ l. referring to previous analysis set each factor dosage gradient (Table 1) [17].
Table 1: Each treatment of experimental factors disposal.
b. Reaction Program Optimization: With the best 5 kinds of parameters, Annealing temperature and thermal cycle number were researched when the other conditions are invariable in thermal cycle. According to previous data, and the tests were designed in three procedures.
i. 1 cycle of 5 minutes at 94 oC to initial denature; 45 cycles of 1 minute at 94oC to denature, 1 minute at 32 oC for annealing, 1.5 minutes at 72oC for extension; 5 minutes at 72 oC for final extension. Stay warm at 4oC.
ii. 1 cycle of 5 minutes at 94oC to initial denature; 45 cycles of 1 minute at 94oC to denature, 1 minute at 40oC for annealing, 1.5 minutes at 72oC for extension; 5 minutes at 72oC for final extension. Stay warm at 4oC.
iii. 1 cycle of 5 minutes at 94oC to initial denature; 50 cycles of 1 minute at 94oC to denature, 1 minute at 40oC for annealing, 1.5 minutes at 72oC for extension; 5 minutes at 72oC for final extension. Stay warm at 4oC. Articulation and numbers of bands in different reaction program were compared [18-20].
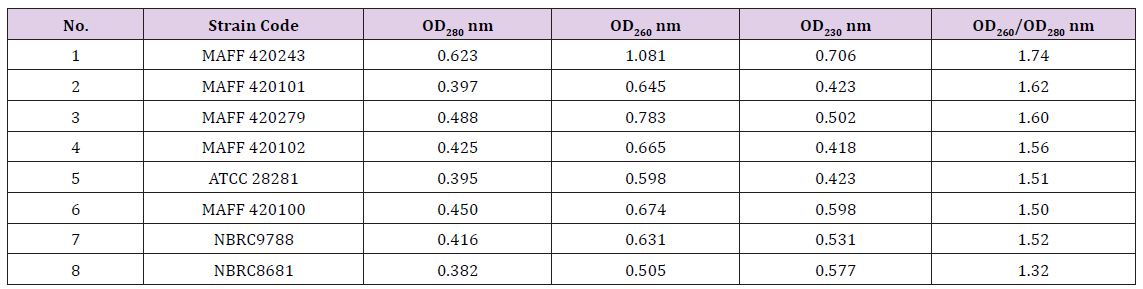
Genomic DNA testing: It can be seen the value of OD260/ OD280 is more than 1.3 in Table 2. It shows that the extraction of DNA does not contain protein and phenol basically, however, it maybe contain some RNA which is no significant influence on PCR amplification. The OD260/OD280 value of eighth strains is 1.32, its DNA color is light yellow, low purity. The OD260/OD280 value of first strains is best (1.74). Its DNA color is almost transparent. Therefore, it was used to carry out the optimization experiment of RAPD system.
Table 2: Uv-spectrophotometer inspection results.
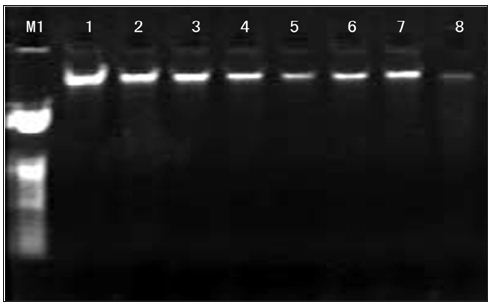
a. Agarose Gel Electrophoresis Detecting: DNA samples of 5μl were placed on 0.7℅ agarose gels containing 0.5μg/ ml ethidium bromide, the electrophoresis was performed in 0.5×TBE buffer at a set voltage of 60V for 30min. We can see that the band of DNA was high quality and without tailing (Figure 3). The results indicate that there were no fragments of degradation. Among them, the bands of first strains is bright, the bands of eighth strains is darker.
Figure 3: The genomic DNA electrophoresis results of Inonotus obliquus. 1-8: Strain code; M1:23kbp DNA Ladder.
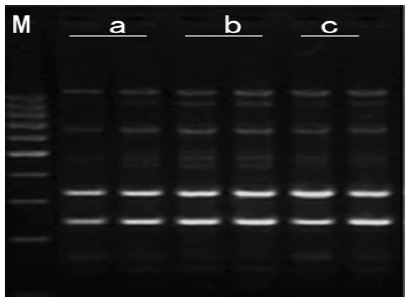
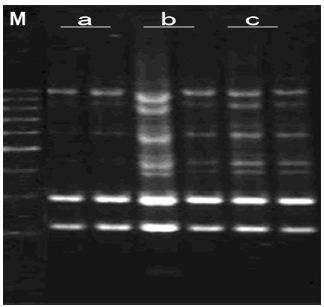
b. Concentration of Genomic DNA: It can be seen bands in concentration three gradients. 30ng/μl genomic DNA: templates and primer didn’t match effectively and band was deficiency and breezing. 40ng/μl genomic DNA: band was distinct, Stable and high-resolution. 50ng/μl genomic DNA: the amplification products were less polymorphics due to more genomic DNA lead to the increase of small segment which run out of primer earlier andMg2+. Therefore, the optimal Concentration of genomic DNA was 40ng/μl (Figure 4).
Figure 4: Effects of template DNA concentration on amplified effect. a-30ng/μl; b-40ng/μl; c-50ng/μl M:200bp DNA Ladder.
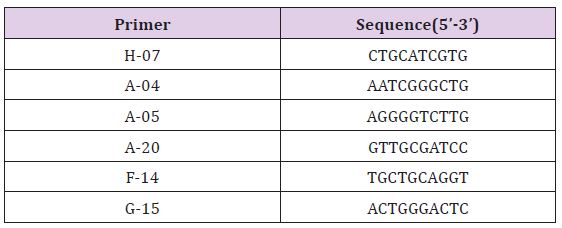
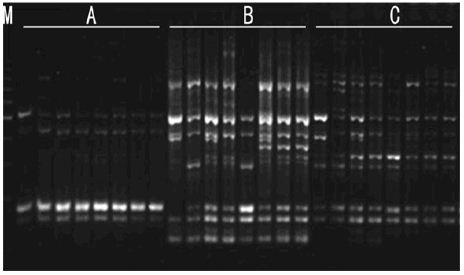
a. Primer Screening: Six primers were selected from a total of 100 random primers found to be effective in generating amplification products (Table 3) and (Figure 5).
Figure 5:RAPD patterns of 6 primers F-14; G-15; A-04; A-05; H-07; A-20; 1-8: Strains No.; M: 200bp DNA Ladder.
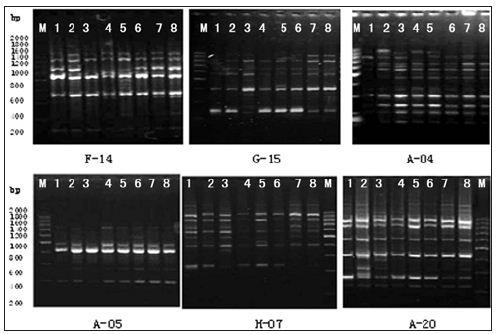
Table 3: Primers used for RAPD amplification and their nucleotide sequences.
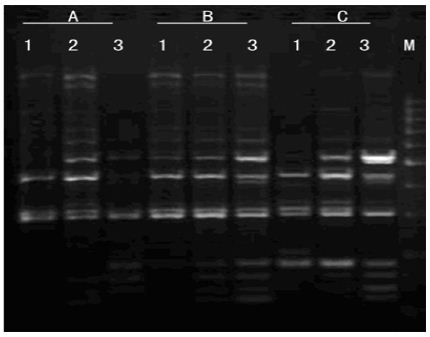
b. Primers Concentration: As shown in Figure 6, while primers concentration is 8pmol, bands was less, indistinct and scarce. This may be because low primers concentration reduced matched probability led to less characteristic bands. With the increasing of the primers concentration, the numbers of bands is increasing. Polymorphic bands were the most abundant, distinct and repeatable as primers concentration was 10pmol and dosage was 2μl and 3μl. Considering the cost, and the best primers concentration is 10pmol, dosage was 2μl.
Figure 6: Effects of primer concentration on amplified effect. A -8pmol; B -10pmol; C -12pmol; 1-1μl 2-2μl 3-3μl M:200bp DNA Ladder.
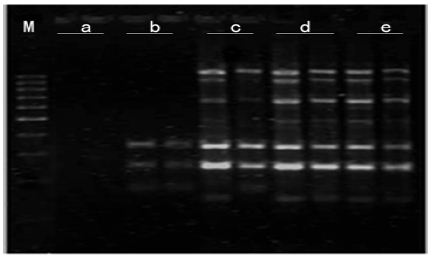
Mg2+ Concentration: As shown in Figure 7, amplification product was none at 0.5mmol/L Mg2+. There were some amplification fragment at 1.0 mmol/L Mg2+, but amplification fragments were short. With the increasing of Mg2+ concentration, amplification bands were more and clearer. The best amplification effect appears at 2.0 mmol/L Mg2+. Due to obvious influence as changing Mg2+ concentration, Mg2+ concentration was critical factor in PCR amplification.
Figure 7: Effects of Mg2+ concentration on amplified effect. a-0.5mmo/L; b-1.0mmol/L; c-1.5mmol/L; d-2.0mmol/L; e-2.5mmol/L; M:200bp DNA Ladder
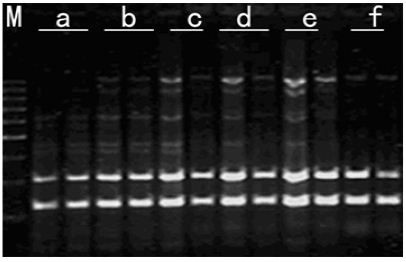
dNTPs Concentration: As shown in Figure 8, six different dNTPs concentration gradient could amplify the band. Band was weak, less and unclear as dNTPs concentration is 50μmol/L. Amplification products became more and more and big fragment reduce gradually and small fragments increase gradually as the increase of the dNTPs concentration. The optimal amplification effect appeared at 100μmol/L dNTPs. It is because too much dNTPs led to increase random combine chance of dNTPs and Template DNA and too much dNTPs combined with Mg2+ and then interfered function of TaqDNA polymerase. Therefore, the optimal dNTPs concentration is 100μmol/L.
Figure 8: Effects of dNTPs concentration on amplified effect. a-50μmol/L; b-100μmol/L; c-150μmol/L; d-200μmol/L; e-250μmol/L; f-300μmol/L; M:200bp DNA Ladder.
TaqDNA Polymerase Concentration: It can be seen from Figure 9, when TaqDNA polymerase was 0.5 units, the bands were less and dim. With the increasing of TaqDNA polymerase concentration, amplification products were more and more gradually. But reaching to a certain extent (1.0 unit), amplification effect was invariableness as increasing the amount of TaqDNA polymerase. Considering the cost and the best TaqDNA polymerase dosage was 1.0 unit.
Figure 9: Effects of Taq DNA polymerase concentration on amplified effect. a-0.5U; b-1.0U; c-1.5U; M: 200bp DNA Ladder
Annealing Temperature and Thermal Cycle Number: As shown in Figure 10, using the first program, bands was weak and less. Bright and abundant bands were obtained as the second program was used. It has appeared nonspecific amplification when cycles were 50 in the third program. It can be observed that the second program, which has 45 cycles and used annealing temperature at 40oC, was the efficient and stable program. This is because annealing temperature is too low, nonspecific combination of most of the primer and template DNA makes amplification results appearing smear phenomenon. In addition, products expressed an exponential growth in the initial period of time of cycle. With the consuming of primers, dNTPs and declining of polymerase activity, the increasing of PCR products gradually converted to the linear growth from the exponential growth, and finally achieved a platform period. At this time, although further increase the cycle number, amplification products did not increase. Unlimited increasing cycle number would only make nonspecific amplification product appear.
Figure 10:Effects of different annealing temperature and number of amplifying cycles on amplified effect. a-program(1); b- program(2); c- program(3); M:200bp DNA Ladder.
The dosage of the template DNA has little effect on amplification, generally, it all appeared amplification product between 10 - 100 ng/μl. But the extraction procedure of template DNA, purity of template DNA, and dilute procedure has very big effect on RAPD amplification. When DNA was extracted, it should pay attention to prevent cross infection. Because PCR amplification is exponential led to a little other DNA could cause the distortion of the results. Usually, template DNA can be used for PCR amplification after coarse extraction, because PCR amplification is based on DNA and not on RNA as template. However, if it contained more protein and phenolic compounds, it would affect PCR amplification and make amplification without product. The more number of Template molecules, the less mistaken amplification. Therefore, certain amount template were necessary, generally, optimal template DNA concentration were 40~50 ng/μl in a volume of 25 uL.
Using the strains of Inonotus obliquus as the materials, the optimal PCR system is that a volume of 25 uL was used which contained 40 ng/μl template DNA, 10 pmol primer, 2mmol/L Mg2+, 1.0 unit domestic Taq DNA polymerase,100μmol/L dNTP, others complement with ddH2O. The amplifications program was that 1 cycle of 5 minutes at 94oC to initial denature; 45 cycles of 1 minute at 94oC to denature, 1 minute at 40oC for annealing, 1.5minutes at 72oC for extension; 5 minutes at 72oC for final extension, stay warm at 4oC. Later studies proved that this reaction system have shown well amplification effect when nearly 100 primers were used in RAPD analysis [21].
I would like to express my sincere appreciation to my supervisor, Dr. Piao Zhongyun for her patient guidance and valuable comments and advice. This work was supported by the Natural Science Foundation of Liaoning province (20170520187)


