info@biomedres.us
+1 (502) 904-2126
One Westbrook Corporate Center, Suite 300, Westchester, IL 60154, USA
Site Map

Received: November 16, 2017; Published: December 04, 2017
Corresponding author: Timo Töysä, Specialty General Practice, Rehabilitation Hospital Vetrea, Pohjolankatu 15, FI-74100 Iisalmi
DOI: 10.26717/BJSTR.2017.01.000564
Objective: It is generally known that pH, Ca and Mg have changed remarkably during 1961-90, but their inter-areal variation seems not have been fully discussed nor explained. Parameters of cropland have been earlier associated with CHD mortality. Silicon (Si) and temperature (Temp) have been earlier assessed with human CHD mortality. In this study we have assessed soil values of 21 Rural Centers (RC) from the 1960’s, 1970’s and 1980’s, [(60’s) (70’s), (80’s)] with respective mean annual temperatures from 1981-2010 and mean groundwater (gw) Si content.
Results: Combined regression by pH(60’s) and pH(70’s) explained pH(80) by 96.8 % (p < 0.001). Ca. (60’s) and Ca.(70’s) explained respectively Ca.(80’s) by 99.3 % (p < 0.001) and Mg.(60’s) and Mg.(70’s) explained respectively Mg.(80’s) by 92.3 % (p < 0.001). Combined regression by Temp and Si explained pH (80’s) by 86.5 % (p < 0.001). Respectively combined regression by Temp and pH (80’s) explained gw Si by 77.5 % (p < 0.001).
Conclusion: Groundwater silicon is associated with the soil matrix factor (sources of groundwater silicon/silicon colloids?), which seems with temperature to explain inter-areal pH variation and obviously is associated with relative local stability of cropland Ca and Mg (and soil fertility). Maybe now is the time to increase Si trials in agriculture.
Abbreviations: RC : Rural Centers; FMI: Finnish Meteorological Institute; ETS: Effective Temperature Sum
It is generally known that pH, Ca and Mg have changed remarkably during 1961-90 [1,2,3] but their inter-areal variation seems not have been fully discussed nor explained. Parameters of cropland have been earlier associated with CHD mortality [4]. In this survey based on old statistics has been discovered great stability in inter-RC soil parameters and connection of this stability with temperature and gw Si.
Soil data is from Eurofins Viljavuuspalvelu as in our earlier publications [1-4]. The soil values [1-3] given as 5 year periods (1961-65, 1966-70,..) were combined to decade periods [(60’s), (70’s), (80’s)]. Values of “(9).Kymenlaakso” and “(10).Etelä- Karjala” were combined to”(9;10).Kymi” by weighting the soil values by their cropland areas in 1988 (4,5). Respectively values of “(17).Keski-Pohjanmaan” and “(18).Oulun” were combined to “(17;18).K-Pohjanmaan, Oulun” and used as such in statistics. Available provincial Si.gw.m data from Geologic Survey of Finland [5] have been changed to approximate RC values by its provincial values as such if RC was totally inside of the province, in other cases by weighting the different Si.gw.w values of different provinces by their cropland areas. Area weights selected for this study as earlier from 1988 [4,5]. The values of RC temperatures were determined by benefiting the map of RCs in Official Statistics of Finland [6] and the map of Finnish Meteorological Institute (FMI) [7], by selecting their central commune and then visually estimating its place between the temperature lines.
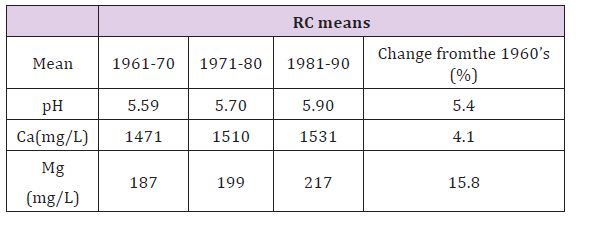
Table 1 shows that the range of periodical changes varied between 5.4 (pH) and 15.8 % (Ca).
Table 1: Changes of the mean RC soil values between the 1960’s and 1980’s.
Combined regression by pH (60’s) and pH (70’s) explained pH (80’s) by 96.8 % (p < 0.001).
Combined regression by Ca. (60’s) and Ca. (70’s) explained Ca. (80’s) by 99.3 % (p < 0.001)
Combined regression by Mg. (60’s) and Mg. (70’s) explained Mg. (80’s) by 92.3 % (p < 0.001)
Combined regression by Temp and Si explained pH.(80’s) by 86.5 % (p < 0.001). (Fig.1)
Computation gave equation: pH [Temp; Si (mg/L)] = 6.02 + 0.16*Temp - 0.11*Si (mg/L).
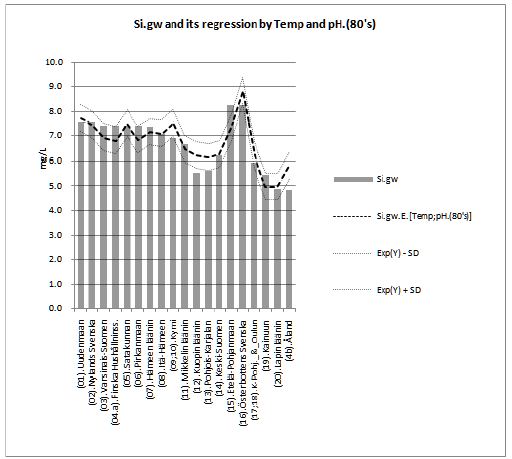
Combined regression by Temp and pH (80’s) explained Si by 77.5 % (p < 0.001):
Computation gave equation: Si (mg/L) = 38.5 + 1.14*Temp - 6.12* pH.
Values (60’s) and (70’s) explained inter-RC variations (80’s) in pH, Ca and Mg by 92-99 %. This stability in proportional inter- RC soil values seems not remarkably to have been affected by the equal nation-wide soil liming recommendations. Soil data have been collected by a private enterprise “Viljavuuspalvelu Oy” (since 2014 “Eurofins Viljavuuspalvelu Oy”) depending on the activity of the farmers. Additionally the number of Mg samples was lower than the number of “basic” samples until 1985, e.g. in 1966-70 the number of Ca samples was ca 400,000, but by Mg “only” ca 33,000” [8]. Obviously less biased sample series could show even higher associations, e.g. combined regression by provincial Si.gw and their capital Temp (4) can explain soil pH variation more than 90 %. This proportional inter-RC stability in the soil factors could explain the stability in proportional CHD mortality between provinces [9]. Association of groundwater with local food could (at least have been) promoted by long-root plants like alfalfa and red clover, which could benefit gw better than short-root plants. Evotranspiration (E0) [10] on Finnish croplands varies with the effective temperature sum (ETS) [11]
Figure 1: Combined regression by pH.(60’s) and pH.(70’s) explained pH.(80’s) by 96.8 % (p < 0.001).
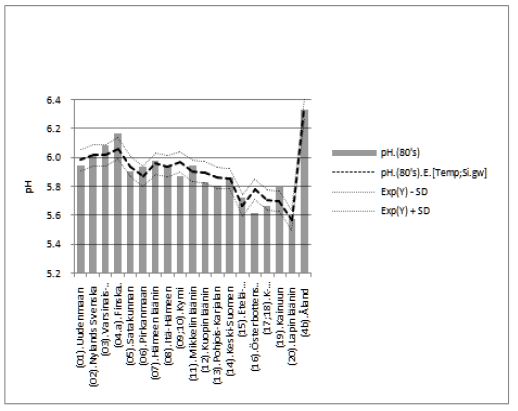
Figure 2: Combined regression by Ca.(60’s) and Ca.(70’s) explained Ca.(80’s) by 99.3 % (p < 0.001).
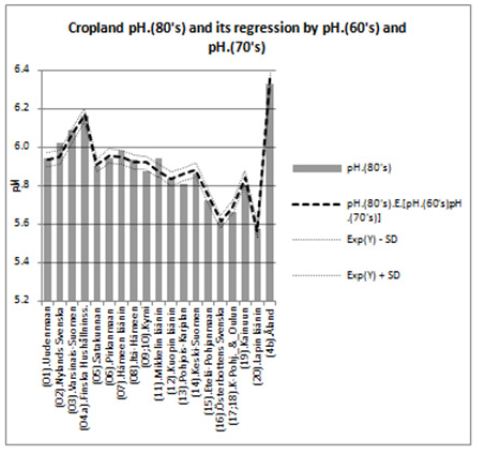
Figure 3: Combined regression by Mg.(60’s) and Mg.(70’s) explained Mg.(80’s) by 92.3 % (p < 0.001).
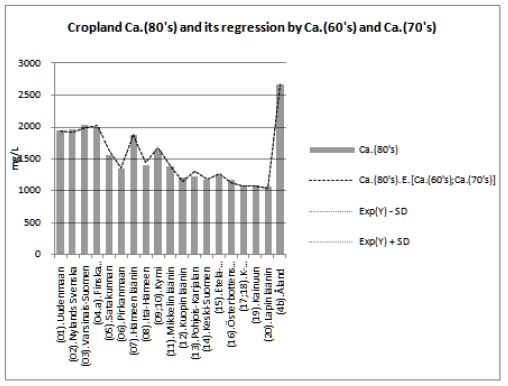
Figure 4: Combined regression by Temp and Si explained pH.(80’s) by 86.5 % (p < 0.001). Computation gave equation: pH [Temp;Si (mg/L)] = 6.02 + 0.16*Temp - 0.11*Si (mg/L).
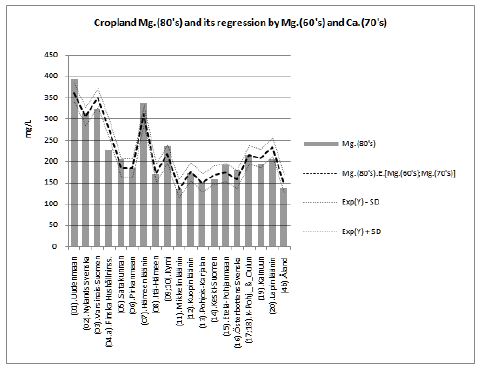
Figure 5: Combined regression by Temp and pH.(80’s) explained Si by 77.5 % (p < 0.001): Computation gave equation: Si (mg/L) = 38.5 + 1.14*Temp - 6.12* pH.
E0 = -100 + 0.388 *ETS (mm year-1), i.e. ca 2.5 - 4 million l/ha.
If one million liters of this came from gw, plants could get annually on the average 15 kg Ca, 3.8 kg Mg/ha and 6.5 kg Si/ha [6]. These values respond ca 1/4 of Ca and 1/3 of Mg total supply by fertilizers at the first half of the 1950’s [12] and possibly several folds the Si given in fertilizers, because in the 1970’s Si/Mg ratio in Finnish food was 0.008 [13]. Losses of Ca and Mg have been replaced, maybe now is the time to correct the Si losses [14-16].
Groundwater silicon is associated with the soil matrix factor (sources of groundwater silicon/silicon colloids?), which seems with temperature to explain inter-areal pH variation and obviously is associated with relative local stability of cropland Ca and Mg (and soil fertility). Maybe now is the time to increase Si trials in agriculture.


