info@biomedres.us
+1 (502) 904-2126
One Westbrook Corporate Center, Suite 300, Westchester, IL 60154, USA
Site Map

Received: November 09, 2017; Published: November 16, 2017
Corresponding author: Jayshree Ramkumar, Analytical Chemistry Division, Bhabha Atomic Research Centre, Mumbai, India-400085
DOI: 10.26717/BJSTR.2017.01.000537
Clinical chemistry is associated with the metabolonomics which is the characterization of metabolome, which is a set of small molecular mass organic compounds found in a given biological medium. Metabolonomics is very important for understanding the toxicity and biomarkers. Mass spectrometry is a very important analytical technique which is used extensive in clinical chemistry. Different types of mass spectrometers are available and thus there is an improvement in the field of clinical chemistry. This overview will touch upon the various aspects of both the clinical chemistry and the mass spectrometry.
Keywords: Clinical chemistry; Mass spectrometry; Ion suppression; Metabolome
Abbreviations: MS: Mass Pectrometry; SPE: Solid-Phase Extraction; NAPQI: N-acetyl-p-benzoquinone Imine; NIH: Institute of Health; HPLC: High-speed high Performance Liquid Chromatography; MALDI: Matrix Assisted Laser Desorption / Ionization; SELDI: Surface Enhanced Laser Desorption Ionization
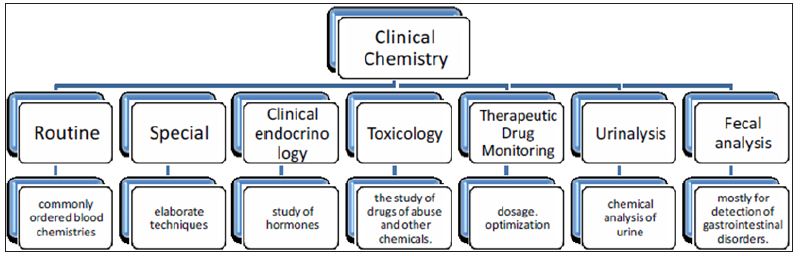
Clinical chemistry [1] can be defined as is the area of clinical pathology that is generally concerned with analysis of bodily fluids. It is also known as chemical pathology, clinical biochemistry or medical biochemistry. The initial study in clinical chemistry in late 19th century was the analysis of various components of blood and urine by simple chemical tests. Then the use of improved technology like spectrophotometric techniques made these analyses more easy and accurate as these are nowadays automated and can be used for a large number of samples. The different biochemical tests can be classified under chemical pathology and are performed mostly on the serum or plasma though can be applied to any body fluid. A large medical laboratory will accept samples for up to about 700 different kinds of tests. Even the largest of laboratories rarely do all these tests themselves, and some must be referred to other labs. This large array of tests can be further sub-categorised into sub-specialities as shown in the organization chart below (Figure 1). Thus it is clear that various types of analysts are present in the samples and techniques like mass spectrometry would definitely be an important tool in terms of sample throughput and detection limits.
Figure 1:
Simply put, mass spectrometry (MS) is an analytical technique that produces spectra (singular spectrum) of the masses of the atoms or molecules comprising a sample of material. The spectra are used to determine the elemental or isotopic signature of a sample, the masses of particles and of molecules, and to elucidate the chemical structures of molecules, such as peptides and other chemical compounds. Mass spectrometry works by ionizing chemical compounds to generate charged molecules or molecule fragments and measuring their mass-to-charge ratios [2-4]. In the present overview, the importance of mass spectrometry will be highlighted with reference to its use in clinical chemistry. Analysis of analyte is carried out in three stages of sample preparation, chromatographic separation and data collection and its interpretation. Each of these stages is extensive in nature and the details are available in literature [5]. This article will attempt to give a brief insight of the various aspects of mass spectrometry in clinical chemistry and the challenges normally encountered.
Sample preparation prior to analysis by mass spectrometry is very crucial and the method adopted depends on the chemical characteristics of the analytes (acidic/basic, lightly/heavily bound) and sample type chosen for analysis (serum/urine). There are a large number of procedures like protein precipitation, liquid-liquid extraction, immunoaffinity purification, dilution and solid phase extraction. However in practice, it is usually a combination of all these procedures that are used [6-12]. This is because the sample matrix decides the procedure adopted. Blood samples are the most difficult samples that need sample preparation because of the complex matrix and low concentration of analytes in the sample. Urine samples can be diluted easily as the concentrations are often higher. Moreover the chemical differences between the analytes of interest and sample matrix decides the preference of sample preparation. Solid-Phase Extraction (SPE) is a separation process by which analytes are separated from matrix owing to differences in their chemical attraction for a solid through which the sample is passed (known as the stationary phase).
The portion that passes through the stationary phase is collected or discarded, depending on whether it contains the desired analytes or undesired impurities. If the portion retained on the stationary phase includes the desired analytes, they can then be removed from the stationary phase for collection in an additional step, in which the stationary phase is treated with an appropriate eluent. SPE results in a rudimentary separation of analytes from potentially interfering matrix components. Immunoaffinity purification (known as immunoextraction) uses antibodies bound to a solid phase to allow for separation of the antibody-bound analytes from the unbound matrix components. For samples with analytes at higher concentrations and less complex matrices, dilution of the sample can be carried out. Introduction of sample into mass spectrometer is an important aspect and it is commonly carried out using a chromatographic method in order to spread out the deliverance of analyte and components of matrix into the mass spectrometer. The chromatographic techniques involve Gas and Liquid Chromatography, wherein the mobile phases are gas (He) and liquid (mixture of aqueous and organic solvents) respectively. The column temperature affects the affinity of the molecules for the stationary phase thus is an important parameter for separating the volatile analytes from matrix components.
The hindrance of functional groups in the analytes in GC analysis can be reduced by derivatization of these compounds. GC-MS is used for comprehensive drug screening in the clinical laboratory. Liquid chromatography (LC) encompasses a variety of analytes and the need for derivatization does not arise. The ratio of the aqueous/organic ratio solvents in the mixture used as mobile phase alters the attraction power between the analytes/matrix with the stationary phase. LC separation though appear similar to SPE is far more precise than the latter.
Analysis by mass spectrometers is possible only when the analytes is in the form of gaseous ions. Therefore ionization methods (convert analytes in solution to gaseous ions) become an important part of mass spectrometry. The main ionization methods adopted in clinical chemistry are electro spray and atmospheric pressure chemical ionization. Electro spray ionization produces smaller droplets of the liquid eluting off from a chromatographic column using combination of voltage, heat, and air, thus increasing the charge per unit volume and the ions (including larger protein species) are sent into the gas phase for analysis by mass spectrometer. In Atmospheric pressure chemical ionization, ions are produced by vaporization of the sample and the electrical discharge produced by plasma, known as coronal discharge ionizes the sample. Different types of mass analyzers are available for analysis.
Basically a mass spectrometer uses a given molecule‘s mass/ charge ratio (m/z) to distinctively identify components of the sample. Different types of mass analyzers are available based on various characteristics like the mass range limit, speed of analysis, mass accuracy and resolution. Time-of-flight (TOF) mass spectrometers use an electric field to accelerate bundles of gas phase ions toward a detector and the time taken is dependent on the m/z of an ion (low m/z ions travel faster). TOF analyzers have in effect indefinite m/z range, very high sensitivity, mass accuracy, and percentage of ion transmission, but a limited dynamic range. Quadrupole analyzers have 4 parallel rods arranged in a square and the charge on these alternate at a set frequency to achieve balanced attraction and repulsion of the ion of interest and thereby a stable path is achieved.
The charge can be changed over the analysis period thus facilitating sequential detection. During the dwell time (period on a millisecond time scale, for which the analyzer remains at a given voltage and frequency), one m/z is detected. Quadrupole analyzers have a limited m/z range, high sensitivity and mass accuracy, but low percentage of ion transmission. Tandem Mass Spectrometry became popular as analyte identification using m/z (morphine / hydromorphone, has m/z peak at ~286) alone does not always give the required specificity. These spectrometers use multiple sets of quadrupoles arranged in series. A common tandem massspectrometry (MS/MS) analyzer will have 3 quadrupoles (referred to as a triple quadrupole mass spectrometer or - triple quad‖). There are many methods of analysis.
The methods of analysis based on linear quadropoles are extensively used in the clinical laboratories. The different methods differ on basis of selectivity of ions detected. Full Scanning is the acquisition of full-spectrum data from a sample and very useful in drug screening and is applicable to more than 200 different drugs or metabolites. However the main disadvantage is the lack of specificity and highly complex mass spectrum thereby reducing its use for routine analysis. When the analyte is known, then the voltage and frequency can be optimized to reduce the interferences from most of the other components in the matrix. This is known as selected ion monitoring (SIM). Thus in this monitoring, both selectivity and specificity for an analyte is high and the spectrum is less complex. It is used for the analysis of very long chained fatty acids. Multiple Reaction Monitoring (MRM) offers best specificity with mass spectrometry. The spectra obtained are less complex and can be used for drug confirmation testing.
MS-based analysis in clinical chemistry has been carried out since 1970s, based on targeted methods focusing on particular metabolites or chemical families [13-16]. Toxicological screening is very common in clinical chemistry and it is involved with the metabolomics [17-20]. The metabolome is a set of small molecular mass organic compounds found in a given biological medium. The analysis of complex proteins known as shotgun proteomics is carried out to a lesser extent. Metabolome consists of molecules that are metabolites (organic substances naturally occurring from the metabolism of a living organism). There are two different kinds of metabolites viz endogenous and exogenous metabolites based on their origin.
Endogenous metabolites could be classified as primary (directly involved in essential life processes e.g. amino acids/ glycolysis) and secondary (species for specific biological function e.g. hormones for mammals) metabolites. Exogenous metabolites represent the biotransformation or metabolism products of exogenous compounds, resulting from modification of the original molecule to introduce a functional group and/or conjugation in enzymatic conversion [21,22]. Metabolomics / metabonomics is the analysis of metabolome in a given condition. Nicholson’s definition underlines the role of two major scientific disciplines used in metabonomics: analytical chemistry and biostatistics. Metabolomics is based on the interpretation of data intended facilitate understanding of biological processes. Biological markers or biomarkers are measurable internal indicators of molecular and/or cellular alterations that may appear in an organism after or during exposure to a toxicant and possible disease [23-25]. According to the National
Institute of Health (NIH), a biomarker is -a characteristic that is objectively measured and evaluated as an indicator of normal biologic processes, pathogenic processes, or pharmacological processes to a therapeutic intervention [25]. Metabolites are highly diverse in chemical characteristics and therefore there is no single technique available for their analysis in biological media. Mass spectrometer is one such instrument for metabolite characterization [26-29]. LC/MS is a very important hyphenation technique used for the clinic chemistry. There are large numbers of reports on the analysis for different compounds to understand nephrotoxicity and hepratoxicity [30-33] by analysis of urine and serum samples. These studies were carried out to understand the mechanism or as biomarkers. Acetaminophen (also known as N-acetyl-p-aminophenol, APAP) is frequently used as a model drug for hepatotoxicity. Normally it is removed from the body through hepatic glucuronide and sulphate conjugation.
Presence of larger amounts results in production of reactive metabolites such as N-acetyl-p-benzoquinone imine (NAPQI) which form a conjugate with glutathione (GSH) and finally is degraded to mercapturic acid derivative that can be detected in urine sample. Thus to understand the mechanism of the changes due to toxicity, the mass spectrometric analysis of urine sample becomes helpful. Also NAPQI can also oxidize glutathione and itself form paracetamol [34]. When GSH is completely removed, the reaction with cell macromolecules occurs and this mechanism is given for understanding the hepatic necrosis that occurs. Mass spectrometric analysis of plasma samples could also be used for understanding the mechanism of hepatotoxicity using long-chain acylcarnitines as biomarkers. Studies could also be used to understand the effect of drugs and the time needed for these to cause some effects. Nowadays studies are also focussed on the understanding of various diseases including cancer [35-38]. Clinical diagnostic measurements are carried out to understand the differences between healthy and diseased states.
Pharmokinetics is a branch of pharmacology that deals with the study of the substances administered externally to a living organism. It derives its name from the Greek words pharmakon and kinetikos which mean drug and moving respectively. It is the study of tracing and monitoring the nature of the drug from the moment it is administered to the point where it is completely eliminated from the body. Pharmokinetics also gives an idea of the absorption and distribution of the drug, chemical changes in the body and the effects and routes of excretion of the metabolites [39]. The dose and site of administration of the drug can also affect its pharmokinetic properties [40]. Mass spectrometry is used for the studies of pharmokinetics as the matrix is very complex and there is a need for a technique which is highly sensitive. The most commonly used instrumentation is the LC-MS with a triple quadrupole mass spectrometer. The use of tandem mass spectrometry enhances the specificity. The determination involves the use of calibration curves and internal standards.
The blank samples prior to drug administration need to be done to ensure the validity of the determination as the sample matrix is quite complex. The calibration curves are mostly linear but the curve fitting with complex functions are also reported as the linear range is much lower than the concentration ranges normally encountered [41]. High-speed high performance liquid chromatography (HPLC) in combination with tandem mass spectrometry was used to analyze phenylbutazone and its metabolites and also propiopromazine and promazine.
Ion suppression occurs when something present in the sample interferes with the ionization process of the analytes. The presences of none or less volatile components reduce the droplet formation and the efficiency of solvent evaporation, resulting in decrease of ion formation. There are various reasons like sample matrix, coelution that can cause ion suppression and these have detrimental effects on both electrospray and atmospheric pressure chemical ionizations. However it has been reported that the effect is more pronounced for electrospray ionization [42]. The studies on biological extract revealed that the main cause of ion suppression is the change in the properties of the spray droplet due to the presence of non-volatile / less volatile components [43]. The presence of non volatile materials like salts, ion pairing agents, endogenous compounds, drugs or metabolites result in the change in the efficiency of the formation or evaporation of droplet. This in turn affects the amount of charged ion that reaches the detector. The mass and charge of individual analytes can cause ion suppression. The molecules with higher mass will suppress the signal of the smaller molecules [44] and also the more polar analytes are prone to suppression [45]. There are different experimental procedures that can be adopted to evaluate the ion suppression. The response of instrument for different calibrators including any internal standards that are injected into the mobile phase. The comparison of the standards added to the pre-extracted samples before extraction or to the specimen matrix can also be used [46].
The different procedures can give different information. The data using the calibrators provides a check of the response value. However the other approaches can show the effect of sample matrix on the Mass spectrometry signal and give an idea whether the loss of signal is due to matrix or due to ion suppression. Ion suppression may result due to the presence of various specimens, both inorganic and organic. The effect of endogenous matrix on ion-suppression is understood by studies [46] wherein it is seen that the donor serum samples were subjected to three separation techniques namely solid-phase, solvent extraction and protein precipitation. To the extracts, caffeine solution was added and analyzed. The results showed that the three extracts contained endogenous components that produced ion suppression > 90% when compared with a caffeine reference solution of same concentration. The injection of drugs or metabolites that maybe present in the specimen is adopted as a coeluting drug does not produce similar mass fragments does not indicate that this compound may not cause ion suppression. The post-column continuous infusion (process of extracting chemical compounds or flavors from plant material in a solvent) into the MS detector [47,48] will give a constant response if there is no ionization interferences.
However, in practice it is seen that there is a suppression of signal corresponding to the void volume of column. The degree of suppression of signal and the time needed for full response is dependent on the nature of the compound [45], sample and its preparation method. It is also possible that ion suppression is not only limited to the column void or initial analysis. It can become more evident during subsequent injections. The ion suppression is also dependent on the concentration of the analyte as this is correlated to the ratio of matrix to analyte. van Hout et al. [48] showed that the ion suppression in the analysis of clenbuterol in urine was 37% and 69 % for a concentrations of 93 and 45 μg/L respectively. These studies showed the advantages of decreasing the matrix to analyte ratio and also the importance of validation of ion suppression measurements in the concentration levels of the analyte normally encountered. Apart from the sample matrix, various other factors also result in ion suppression. The chromatographic ion pairing reagents present in the mobile phase can also affect the signal intensity. Moreover, since these are present in the mobile phase, the effect on ion suppression will be observed throughout the analysis. The solution to this problem is to select an alternative ion pairing agent which is normally a weaker acid. This kind of approach is adopted where in acids like acetic, formic etc are used instead of trifluoroacetic acid.
However if the need to use trifluoroacetic acid arises, then its concentration can be reduced or surface tension lowering modifiers can be added to decrease the effect on ion suppression [49]. There is a process known as - TFA Fix‖ wherein the post-column addition of a sheath liquid of propanoic acid (10%) in 2-propanol is added. There are reports wherein 2-(2-methoxyethoxy) ethanol has been used as a signal enhancer [50] to eliminate the ion suppression due to acetate ions and a 100 fold enhancement was achieved. Another approach is to use the chromatographic conditions to enable the elution of compounds of interest in a region of low or no ion suppression. However this may increase the elution time [51]. As most of the HPLC assays include an internal standard, the conditions are modified so that both the compound of interest and internal standard coelute [52] and the ion suppression for both the compounds will be equal as the peaks coincide. If a stable isotope internal standard is available then the degree of ion suppression will be identical. However it is worth noting that even the use of an internal standard may not completely overcome the problems associated with the accuracy or precision of an analysis which is associated with ion suppression as the ion suppression results in decrease of signal and the signal to noise ratio will be reduced to such an extent that the accuracy and precision will be severely affected. Thus the evaluation of ion suppression is of great importance even when internal standard is used. The ion suppression is also an important parameter that has to be evaluated not only in ESI interfaces but also other MS techniques such as Fourier transform (FTMS), matrix assisted laser desorption / ionization (MALDI) and surface enhanced laser desorption ionization (SELDI) [53-55].
The metabolome is characterized by a large diversity of chemical structures. The use of LC-MS has gained popularity due to its versatility, sensitivity. This overview gave an insight to the some of the applications of LC-MS in clinical chemistry. The main focus of this over view was to give a simple picture of the both technical and non-technical aspects in a very concise manner. The applications of LC-MS in field of toxicology and as biomarkers have been touched upon. It needs to be understood that the field of clinical chemistry is one among its kind as the information needed is always growing and no study can final. The Literature of course gives the readers the understanding to these problems but in reality the toxicity could arise due to various complex factors and to understand these combinations of many targeted approaches are needed to provide the clinical chemist with the information.
However it is to be mentioned without fail that the constant improvements in mass spectrometry has improved the efficiency of the approaches by making it possible to identify metabolites of interest. Metabolomics is the combination of analytical chemistry, statistics and bioinformatics tools used separately or together to perform the various steps of sample preparation, viz, acquisition of metabolic fingerprints, automatic detection of ions, statistical analyses and identification. Each step is itself a complete science in its own way. The data generated is so large that it needs correct understanding and discrimination to be able to analyze them. This is one of the most important challenges in the field of metabolomics. The mass spectral libraries (available for APIMS- based metabolomics: mass spectral and CID mass spectral libraries) are useful for interpretation of biological datasets and to characterize unknown components. Ongoing improvement in this field is becoming a reality with the information obtained from various researchers and sharing of the spectral libraries in order to help in the characterization of unknown metabolites of toxicological and clinical relevance.


