info@biomedres.us
+1 (502) 904-2126
One Westbrook Corporate Center, Suite 300, Westchester, IL 60154, USA
Site Map

Received: September 09, 2017; Published: October 27, 2017
Corresponding author: Bidyadhar Dehury, India Health Action Trust, UP-TSU Office, No. 404, 4th Floor & 505, 5th Floor, No. 20-A, Ratan Square, Vidhan Sabha Marg, Lucknow-226001, Uttar Pradesh, India
DOI: 10.26717/BJSTR.2017.01.000467
Poverty and illiteracy are the greatest challenges in the process of development. Though India has witnessed tremendous improvement both in reducing poverty and increasing literacy rate, the inter-district variations and differentials within different population subgroups are still large. Using the Census of India, 2011 data this paper attempts to understand the inter-district variations in poverty and literacy status and also differentials of literacy rate among different social sub-groups. The census of India collects the information on seven household assets. These are used to construct the wealth index as a proxy for consumption poverty using Principal Component Analysis from inter-district variations. The preliminary results show that the inter-district and intra-district variations are large in assets possession.
India has 17.8% of the households those do not possess any of the specified household assets with lowest in Chennai district of Tamil Nadu with less than one percent and highest in Dindori district of Madhya Pradesh with 64.9%. With respect to the effective literacy status, India has 73% of literate population among 7 years and above. After classifying the effective literacy status by poverty, it is found that the effective literacy rate among the districts from lowest wealth tertile was 66.1% compared to 80.7% among the districts from higher wealth tertile. The study found a positive and high correlation of 0.611 between wealth score and effective literacy rate at the district level. However, there are certain districts which had low effective literacy rate despite high wealth score. The study also observed that the females especially among ST population are still far lag behind to achieve satisfactory effective literacy level in India. Thus, immediate interventions should be addressed among the most disadvantaged districts and especially the females among ST population.
Keywords: Inter-district disparity; Wealth index; Effective literacy rate; Census of India
Eradicating Poverty and hunger in its all forms, and education for all are two critical components in both international and national development agenda and government schemes. However, these two are the major concerns in developing countries. In Indian context, majority of the population are living in poverty and majority of them are deprived from some primary education. In last two decades, India has shown improvement both in reducing poverty and increasing literacy rate. Poverty has reduced by half from 45.3% in 1993-94 to 21.9% in 2011-12 (planning commission, 2013), while literacy rate increased from 52.2% in 1991 to 73% in 2011 (census). Despite the improvement in poverty and literacy still there are most of the people die due to hunger and more than one-fourth of the total population are not able to read and write.
Also regional disparities as well as social disparities in poverty and education increasing over period of time Rukhsana and Alam [1]; Shivakumar and Vijay [2]; Shafiqullah [3]. Studies found that the BIMARU states are lagging behind both in poverty and education than other states of India Shivakumar and Vijay [2]. Poverty in any means leads people deprive and vulnerable. There is a general agreement that improvement in educational status reduces the level of poverty. On the other side poverty becomes an obstacle to access basic education. The poor people are often not able to access their basic needs and rights. It is evidenced that the poor people tend to have lower level of education. Education is generally considered as an important instrument for social, economic and cultural development. It can reduce most deprivation and vulnerability. Acquiring basic education is the most important ingredient in building a nation Haq and Haq [4].
Poverty and literacy have greater impact on life. Literacy is considered as an important tool to get rid from the poverty trap. This has also many social, economic and demographic implications on life. Literacy leads to awareness and illiteracy leads to ignorance. The awareness leads to access the needs and rights. Thus it is considered as most important weapon for the development of the individual as well as the society. Though the literacy status has great importance in development for any society, more than one-fourth of the Indian’s can’t even read and write. Access to higher education in India is even very low where only 6-7 percent of the Indian youthin the age group 17-23 has access to higher education Das [5]. This literacy situation varies greatly across the geographical boundaries as well as across the population subgroups. Literatures on poverty and literacy status found a negative relationship between poverty and education. Studies argued that increasing budgetary allocation alone without reducing the poverty level would not be sufficient to improve the education level Ahmad and Batul [6].
The school drop-out is significantly associated with the state poverty level in India Basumatary [7]. Census of India periodically collects the information on literacy status in its complete enumeration process in every ten years gap. It will be very useful to examine the literacy status at the district level as it is one of the most important indicators for the development. For the development of any society it needs more educated people for the social and economic growth. This paper aims to measure the inter-district variations in asset possession and literacy status in India. Further it aims at examining the social disparities in literacy status in India. This research hypothesized that the literacy rate is low among the low asset possession districts.
Present study is based on the secondary data. This paper used the available district level data on possession of household assets and literacy status from the Census of India, 2011. Census of India does not collect direct economic measures (income/consumption) rather collects information on household possession on seven variables; Radio/Transitor, Television, Computer/Laptop with or without internet, Telephone/Mobile/Both telephone and mobile, Bicycle, Scooter/Motorcycle/Moped, and Car/Jeep/Van. These asset variables are used as proxy for direct economic measures. Literacy status among those seven years and above is available in Census. According to the census of India, the persons those are seven years and above can able to read and write are considered as literates. In this paper the literacy rates are calculated for all population, SC and ST population by males and females. The analysis is done for all 640 districts in India; 609 districts have SC population and 585 districts have ST population.
Descriptive statistics are used to analyze the inter-district variations in poverty and literacy status in India. Percentages are first calculated from the absolute numbers. Ranks are assigned to the districts according to the poverty and literacy rate. The principal component analysis (PCA) is used to construct wealth index using the household asset possession. The census of India collects information on asset possession at the household level. Actual income of the household is not collected by the Census of India. Thus in this study, wealth index is constructed using the economic proxy variables. The factors are extracted on the basis of inter-district variations in the household asset variables.
The first component captures the maximum variability about 54.7% and that has been considered for constructing the wealth index. Through PCA, all districts have assigned a score i.e. wealth score and this is measured as poverty at district level. The districts are ranked according to the wealth score; 1st rank is given to the district with highest wealth score. The districts are also classified into three equal groups (tertile) according to the wealth score. The alpha index of 0.72 indicating the wealth index is reliable.
Relative literacy achievement index is also calculated among the districts. This is calculated using the following formula:
Relative literacy achievement index = (Actual literacy rate – Minimum literacy rate)/(Maximum-Minimum)
The value of relative literacy achievement index varies from 0 to 1. The district with lowest literacy rate will get the value of 0 and the district with highest literacy rate will get the value of 1. All the districts are grouped into tertile according to the relative literacy achievement values.
Inter-District Variations In Possession Of Household Assets: Before discussing inter-district variation in wealth index a portrayal of inter-district scenario in asset possession would be helpful to overview the poverty level in the country. Figure 1 provides the percentage of households with specified household assets. The figure shows that majority of the Indian households have telephone/mobile (63.2%) followed by television (47.2%), and bicycle (44.8%). Little more than one-fifth households (21%) and about one-fifth households have possessed scooter/ motorcycle/moped and radio/transit respectively. Possession of computer/laptop with or without internet and car/jeep/van was 9.5% and 4.7% respectively. Besides, one important information regarding the asset possession was collected by the census is that the households possess none of the specified assets.
Figure 1: % of households with possession of household assets in India, 2011.
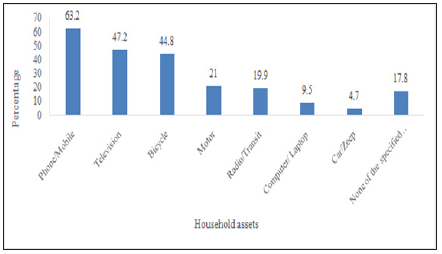
The households without any of the specified assets are considered as sever poor households. India have 17.8% of the households those do not possess any of these household assets. Among the states it varies from as low as 4.4% in Punjab to as high as 35.8% in Meghalaya. Similarly, among the union territories percentage of households with none of the specified assets varies from 1.9% in Lakshadweep to 24.9 in Dadra and Nagar Haveli. At thedistrict level, a large inter-district variation found in the possession of household assets. Among the districts Dindori district of Madhya Pradesh has the highest percentage of households (64.9%) with none of the specified assets and Chennai district of Tamil Nadu has the lowest percentage of households (less than one percentage) with none of the specified household assets. The inter-district variations within the state is also found very high (for example in Madhya Pradesh it varies from 8.1% in Indore district to 64.9% in Dindori district)
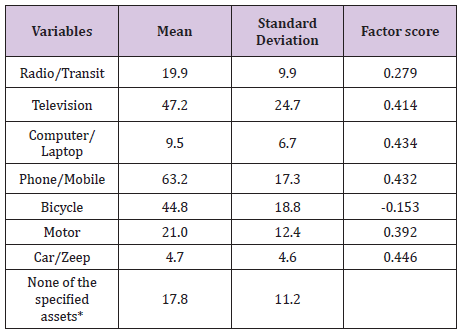
Inter-district variations in wealth index: Using the principal component analysis (PCA) a wealth index is constructed from inter-district variations in seven household asset possession (Radio/Transitor, Television, Computer/Laptop with or without internet, Telephone/Mobile/Both telephone and mobile, Bicycle, Scooter/Motorcycle/Moped, and Car/Jeep/Van). Table 1 describes the mean, standard deviation and factor scores. At the district level, possession of television has the maximum variation with the standard deviation (SD) of 24.0 followed by bicycle with SD of 22.1, phone/mobile with SD of 18.7, scoter/motor cycle/moped with SD of 12.2 and radio/transistor with SD of11.4. Least inter-district variation was found in computer/laptop and car/jeep/van with the standard deviation of 5.7 and 4.7. The factor scores have positive values except bicycle. A positive factor score indicates higher economic status and a negative value indicates lower economic status. Car/jeep/van, computer/laptop, and phone/mobile have higher factor scores compared to other variables. Figure 2 shows the distribution of factor scores for component 1 among the districts in India. The figure shows that the factor scores are negatively skewed indicating less number of districts have very high factor scores.
Figure 2: Distribution of wealth scores for component 1.
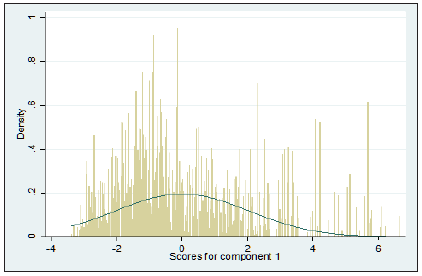
Table 1: Mean standard deviation and factor score of asset variables in India, 2011.
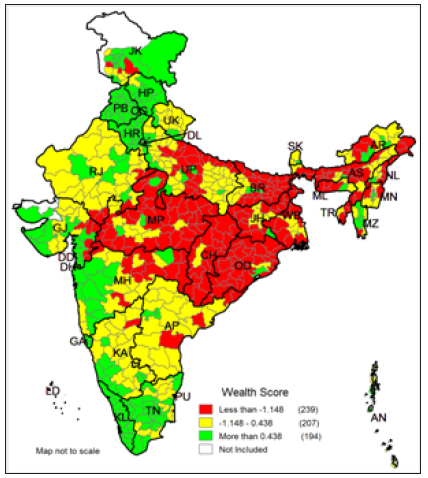
Inter-district variation in wealth score and the rank are presented in (Appendix A1). East district of NCT Delhi has the highest (1st) rank in possession of household assets and Bijapur district of Chhattisgarh has the lowest (640th) rank. Mostly the districts from Chhattisgarh, Odisha, Madhya Pradesh, Jharkhand, Bihar, Assam and West Bengal possess low wealth score. Large intra-district variations are also observed in possession of wealth score in India. Figure 3 displays a cartographic presentation where all the 640 districts of India are grouped into three categories according to the factors scores. The map shows that the districts under central region, eastern and north eastern had low factor scores indicating low household possession.
Figure 3: Classification of Indian districts according to the wealth score, 2011.
(Appendix A1) 10.26717/BJSTR.MS.ID.000467Appendix1.pdf
The districts from Madhya Pradesh, Chhattisgarh, Odisha, Jharkhand, Bihar, Uttar Pradesh and districts from north-eastern states comes under the low wealth index category. The districts from Kerala, Tamil Nadu, Maharashtra, Gujarat, Punjab, Haryana, Himachal Pradesh and Jammu and Kashmir fall under the high wealth index category. The districts those belonged to low wealth index category constitute 28.5% of the total population or 345 million people where medium wealth index districts constitute 35.4% or 428 million people and high wealth index districts constitute 36.1% of the total Indian population or 437 million people.
Effective literacy status in India: (Appendix A2) presents the effective literacy status for all population, SC and ST population subgroups by sex. The effective literacy rate of India was witnessed a tremendous growth from 64.8% in 2001 to 73% in 2011. However, the effective literacy rate among SC and ST population remained low at 66.1% and 59% respectively. In India the male literacy rate was 80.9% and the female literacy rate was 64.6%. The gap between male and female literacy rate is 16.3 percentage points which seems females are lag behind in literacy rate. These gaps are higher among SC population (18.7 percentage points) and highest among ST groups (19.2 percentage points). More than half of the females among ST are illiterates. Among the SC population the literacy rate is 56.5%.
Inter-district disparities in effective literacy rate: (Appendix A2) shows that Serchhip district of Mizoram holds the 1st rank among the districts in literacy rate with 98% of literacy rate while Alirajpur district of Madhya Pradesh holds the 640th rank with36% of literacy rate. There are 15 districts in India where more than half of the population are illiterate. Intra-district variations within the states are also found in India. (Figures 4-6) presents the interdistrict variations in effective literacy rates. All the districts are grouped into three categories according to the effective literacy rate; less than 65%, 65% - 80%, and more than 80%. Figure 4 shows the inter-district variation in total effective literacy rate. There are 158 districts where the literacy rate is less than 65%, 325 districts have the literacy rate between 65% to 80% and 158 districts have literacy rate of more than 80%. Kerala is the only state which has all districts with more than 90%. The total literacy rate of Kerala is 94%.
Figure 4: Classification of Indian districts according to the effective literacy rate in India, 2011.
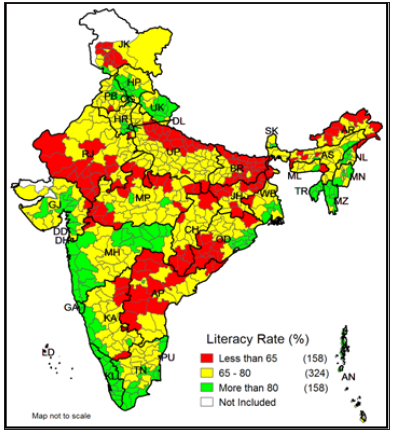
Figure 5: Classification of Indian districts according to the effective male literacy rate in India, 2011.
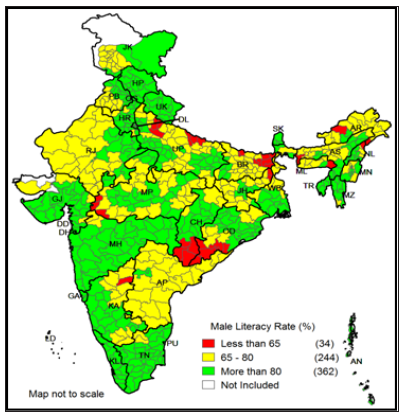
Figure 6: Classification of Indian districts according to the effective female literacy rate in India, 2011.
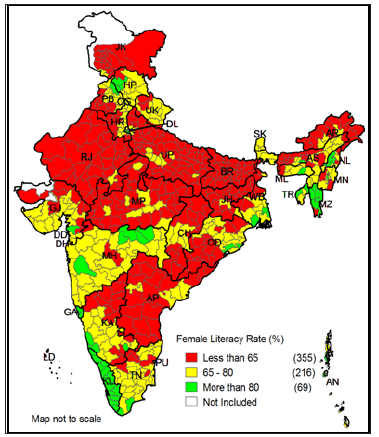
The districts with low literacy rate are basically southern districts of Odisha and Chhattisgarh, western and northern districts of Andhra Pradesh, few districts from Madhya Pradesh, southern districts of Rajasthan, northern districts of Uttar Pradesh, eastern districts of Bihar and Jharkhand, and few districts from Arunachal Pradesh. Figure 5 shows that there are 34 districts in India where the male effective literacy is less than 65%, while 362 districts have more than 80% and 244 districts have 65% - 80% of male literacy rate. However, the distribution of female effective literacy status is just contrast to the distribution of male literacy rate. Figure 6 shows that in India majority of the districts (355 districts) have the female effective literacy rate of less than 65% and another 216 districts have the literacy rate of 65% - 80%. There are only 69 districts have the literacy rate of more than 80%.
Social disparities in literacy rate (SC and ST): The SC and ST population is witnessed of low literacy rate both among male and female literacy than the total population. Figures 7-9 shows the literacy maps for SC population. Figure 7 shows that among the SC population there are 235 districts in India have the literacy rate of less than 65%, 269 districts have 65% - 80%, and 105 districts have more than 80% literacy rate out of 609 districts. Alirajpur district of Madhya Pradesh has lowest literacy rate among SC population with 35.6% and Serchhip district of Mizoram, Shupiyan and Pulwamadistricts of Kashmir have 100% literacy among SC population. Figure 8 shows that there are 73 districts have less than 65% male literacy and 268 districts have male literacy rate of 65%-80% and another 268 districts have more than 80% male literacy rate.
Figure 7: Classification of Indian districts according to the literacy rate among SC population in India, 2011.
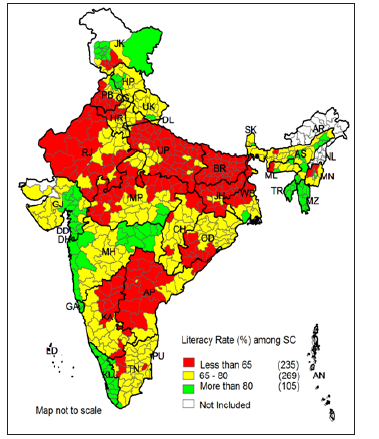
Figure 8: Classification of Indian districts according to the literacy rate among SC male population in India, 2011.
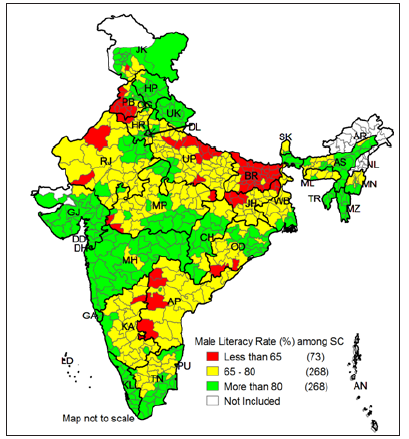
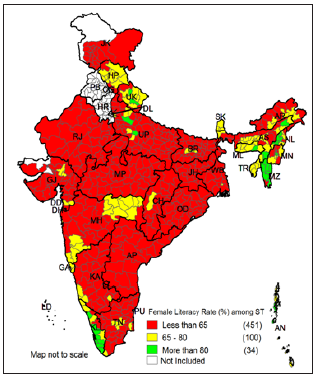
Figure 9 shows that majority of the districts (401 districts) have less than 65% female literacy among SC population. Figure 10, 11 and 12 presents the literacy maps for ST population. Figure 10 shows that among the ST population 340 districts out of 585 districts have less than 65% of literacy rate, 182 districts have 65% - 80%, and 63 districts have more than 80% of literacy rate. Kaushambi district of Uttar Pradesh has lowest literacy rate amongST population with 9.8% and Aizawl district of Mizoram has highest literacy rate with 98%. Figure 11 shows that there are 195 districts which have less than 65% of male literacy among ST population and there are 156 districts have more than 80% literacy rate. However, it is worst among the ST female population. The Figure 12 shows that majority of the districts (451 districts) have less than 65% of female literacy rate among ST population. There are only 34 districts which have more than 80% of female literacy rate among the ST population.
Figure 9: Classification of Indian districts according to the literacy rate among SC female population in India, 2011.
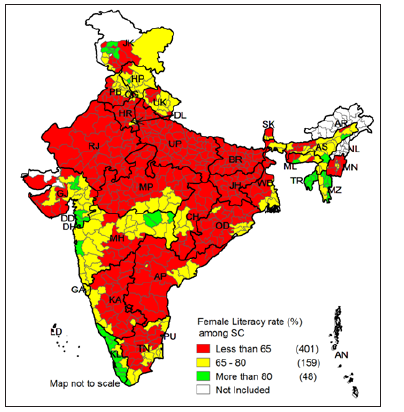
Figure 10: Classification of Indian districts according to the literacy rate among ST population in India, 2011..

Figure 11: Classification of Indian districts according to the male literacy rate among ST population in India, 2011.
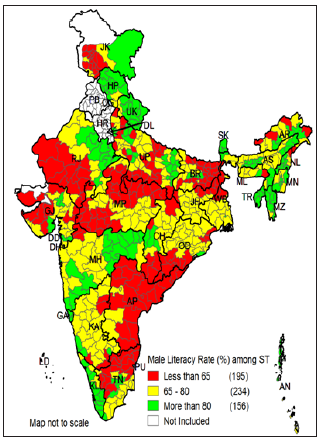
Figure 12: Classification of Indian districts according to the female literacy rate among ST population in India, 2011.
Poverty and literacy status: The literacy rate in India is largely varied by wealth index. Table 2 presents the weighted average of literacy rate by wealth index in India. It is observed that the literacy rate was much lower among the districts those belong to lowest wealth tertile and higher among the districts those belong to upper wealth tertile. For example, the literacy rate was 66.6% among the districts belong to low wealth index, 71.1% among medium districts and 81.4% among the districts belong to high wealth index. The gap between high and low wealth index districts was 16.8 percentage points and the ratio was 1.22 and high to medium was 1.15. It clearly shows that the literacy rate largely varies by the wealth score. The male literacy rates are found higher in all group of districts compared to the female literacy rate.
Table 2: Literacy rate (%) by wealth index and sex in India, 2011.
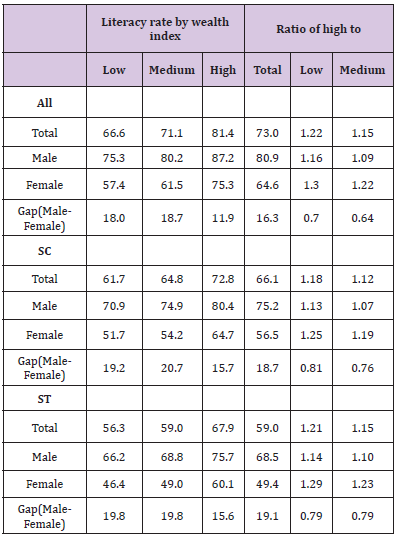
However, the male-female gap in effective literacy rate are found higher in medium and low wealth index districts with more than 18 percentage points and it was low in high weight index districts with less than 12 percentage points. The literacy rate also observed very high in the highest wealth tertile groups among both SC and ST population in India. But the gap between highest and lowest tertile among both SC and St is comparatively low than the overall population. Among the SC population the literacy rate is 61.4% in lowest tertile districts compared to 64% in middle tertile and 72.3% in highest tertile districts. Similarly, among the ST population the literacy rate is 55.9% in lowest tertile districts compared to 59.1% in middle tertile and 67.1% in highest tertile districts.
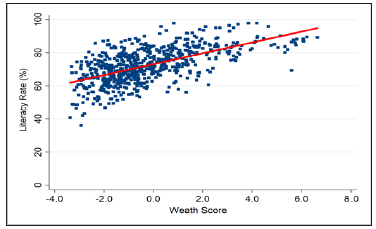
The districts are ranked according to the wealth score as well as according to the literacy rate (Appendix 2). Figure 13 shows the scatter plot and spearman correlation coefficient of wealth score and literacy rate at the district level. The correlation coefficient between wealth score and literacy rate is 0.611 at the district level showing a positive and high relationship between these two variables. The scatter plot also suggests that the districts with low wealth score tend to have low literacy rate and vice versa. The trend line clearly shows that as the wealth score increases the literacy rate also increases. From the (Appendix 2) it is also clear that the districts those have high wealth score also have high literacy rate. However, there are few districts have low wealth score but have high level of literacy rate. For example, Serchhip district have the highest literacy rate despite holding 186th rank in wealth score. Similarly, there are also few districts which possess high wealth score but have low level of literacy rate. Figure 14 shows the classification of districts on the basis of wealth index and relative literacy achievement index in India. It shows that there are 133 districts have high scores both in wealth and literacy and 130 districts have low scores both in wealth and literacy. However, there are 16 states basically the districts from Rajasthan, Punjab, Jammu and Kashmir, Andhra Pradesh, and Tamil Nadu which have high wealth score but have low literacy achievement score. Similarly, there are 24 districts which have low wealth score but have high literacy achievement score.
(Appendix A2) 10.26717/BJSTR.MS.ID.000467Appendix2.pdf
Figure 13: Scatter plot of wealth score and literacy rate at district level in India.
The literacy rates are regressed at the district level to examine the influence of poverty on literacy status in India. The dependent variable that is the literacy rate is continuous variable. The wealth score at the district level that are derived from a set of asset variables using PCA is the prime independent variable. Other covariates such as mean household size, urbanization, sex ratio, percentage of ST population are also included in the model thoughts to influence the literacy status. Table 3 provides the regression results of literacy rates in India. The result suggests that poverty and mean household size are two most important factors of the literacy rate in India. The coefficient of wealth index score is 2.878 (p=0.00; 95% CI: 2.394 - 3.362) showing a very significant factor. The wealth score is positively associated with the literacy status. Increase in asset possession leads to increase in literacy rates in India. Other than poverty, mean household size is also found a significant factor with the coefficient of -3.601 (p=0.000; 95% CI=-4.521 - -2.682).
Figure 14: Classification of Indian districts according to the literacy rate among ST population in India, 2011.
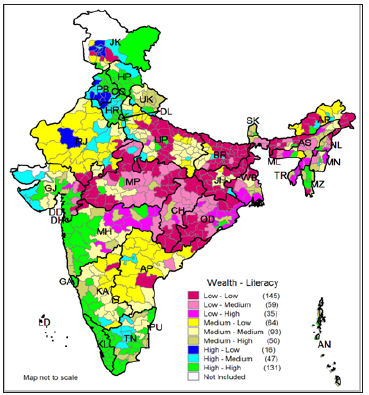
Table 3: Regression analysis of literacy rate in India.
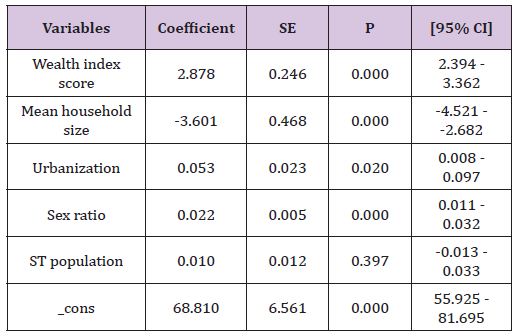
R-squared =0.482
N =640
This study is attempting to highlight the insight view of poverty and literacy status at micro level in India. Micro level planning is very important for the inclusive growth. Poverty and illiteracy are two major obstacles on the way of inclusive growth in developing countries like India. These two indicators are the central focus in many national and international agenda like Millennium Development Goals and other agenda. Eradication ofextreme hunger and poverty, and eradication of illiteracy are two important goals among the eight millennium development goals set by the United Nations. Using the recent available census of India 2011 data at district level on household assets and literacy status, this paper found that there are certain districts in India still do not possess any of the specified assets. The poverty level persists in some certain clusters in India.
On the other hand, though India has witnessed satisfactory growth in literacy rate during last decade still there are more than one fourth Indian population cannot able to read and write. The census 2011 data shows that 73% of the total Indian population are literates. This figure varies largely by the population sub-groups and across the states and districts. Across all sub-group population and districts, the literacy rate was found lower among the females. Other studies also found that the girls have lower literacy than the boys in the Indian districts where more women are in the labor force Sundaram and Vanneman [8]. There are many districts where more than half of the female population can’t read and write. The poor states in India are witnessed of low literacy rate. Kerala is the only state which achieved more than 90% literacy rate in all districts and also among male and female literacy [9]. Immediate interventions should be addressed to eradicate the poverty as well as the literacy rate among the most backward districts and most disadvantage population sub-groups. Poverty level should be reduced to achieve the universal literacy rate. The districts from Odisha, Chhattisgarh, Madhya Pradesh, Rajasthan, Jharkhand, Bihar, Uttar Pradesh and Andhra Pradesh need special focus to improve the literacy status. These states are also found very poor states in India. The female literacy rate should be the prime focus in the agenda.


