info@biomedres.us
+1 (502) 904-2126
One Westbrook Corporate Center, Suite 300, Westchester, IL 60154, USA
Site Map
Received: September 12, 2017; Published: September 22, 2017
Corresponding author: Olaf A Runquist, Department of Chemistry, Hamline University, St. Paul, MN 55104; USA
DOI: 10.26717/BJSTR.2017.01.000386
Objectives : To determine latent time (quiescence) properties of human colonic crypt cells and explores relationships between these properties and Colorectal Cancer (CRC) development.
Methods : Quantitative methods were developed to calculate latent time1 (latenzzeit) of colonic cells at each position along the crypt axis and to evaluate available data on total cell cycle times for human normal, familial adenomatous polyposis (FAP), and adenomatous crypts.
Results : Our analysis of normal colonic data revealed that latenzzeit decreases from crypt base to top. Moreover, alogarithmic plot of latenzzeit versus crypt position was non-linear, but was equal to sum of three lines showing that latenzzeit has three components (slow, medium fast). A similar plot of FAP data was on linear and equal to sum of three lines, but slopes and intercepts were not equal to results for normal crypts. A logarithmic plot of adenomatous crypt data was linear showing loss of two latenzzeit components (slow & fast) and retention of one (medium) component.
Conclusions : Our data indicate that, in normal crypts, latenzzeit is regulated by three sequential, first order kinetic processes. Quantifying latenzzeit in neo-plastic crypts provides a measure of the effects of APC mutations in CRC development. In FAP crypts, heterozygous APC mutation modifies latenzzeit by affecting all three kinetic processes. In adenomatous crypts, homozygous mutant APC modifies latenzzeit through loss of two and modification of the third process.
Latenzzeit also explains control of total cell cycle time. In normal crypts, the decrease in total cell cycle time along the crypt axis can be attributed to decrease in latenzzeit from crypt base to top. In neo-plastic crypts, changes in latenzzeit explain progressive lengthening of the total cell cycle time along the axes of FAP and adenomatous crypts. Thus, latenzzeit regulatory mechanisms appear essential for crypt maintenance and, when altered, contribute to development of CRC.
Keywords : Latent time; Quiescence; Latenzzeit; Colon cancer; Familial adenomatous polyposis; Cell Cycle
Abbreviations : “i” = crypt cell position expressed as fraction along crypt axis (relative to total crypt length); ADA = adenomatous crypts; APC = adenomatous polyposis gene; AUC = area under the curve; CRC = colorectal cancer; FAP = familial adenomatous polyposis; FP = fraction of proliferative cells; FPi = fraction of proliferative cells at each “i”; FPR i ADA = fraction of proliferative cells at each “i” for ADA crypts; FFPR i FAP =fraction of proliferative cells at each “i” for FAP crypts; FFPR i NOR = fraction of proliferative cells at each “i” for NOR crypts; Fs = fraction of cells being in S-phase; Fs i = fraction of S cells at each “i”; L(z-a)i FAP = set of values for Lzi FAP minus “a-line” values – designated “b” line FAP; L(z-a) i NOR = set of values for Lzi NOR minus “a-line” values – designated “b” line NOR; L(z-a-b)i NOR = set of values for Lzi FAP minus “a+b-line” values – designated “c” line FAP; L(z-a-b)i NOR = set of values for Lzi NOR minus “a+b-line” values – designated “c” line NOR; LI = labeling index; LImax = LI maxima; ln[Lzi ADA] = logarithmic plot of Lzi for adenomatous crypt data; ln[Lzi FAP] = logarithmic plot of Lzi for FAP crypt data; ln[Lzi NOR] = logarithmic plot of Lzi for normal crypt data; ln[Lzi] = logarithmic plot of Lzi; Lz = latenzzeit (latent time or quiescence); Lzi = Lz at a given crypt position “i”; Lzi ADA = Lzi for adenomatous crypts; Lzi FAP = Lzi for FAP crypts; Lzi NOR = Lzi for normal crypts; NOR = normal; PS = probability of cells being in S-phase; PS i = probability of S cells at each “i”; Psi ADA = probability of ADA cells at crypt position “i” being in S phase (FS i ADA/FPR i ADA) Tc i ADA = Tc i for adenomatous crypts (TS/Psi ADA); Tc = total cell cycle time; Tc i = Tc at a given crypt position “i”; Tc i NOR = Tc i for normal crypts or Tc i minus Tc lim; Tc lim = limiting cell cycle time at the crypt top (“i” = 1.0); Tc lim FAP = Tc lim for FAP crypts; Tc lim NOR = limiting Tc i at top of normal crypts; Tc lim NOR = Tc lim for normal crypts; TG1 = time of G1 phase; TG2 = time of G2 phase; TM = time of M phase; TS = time of S phase
1In this report, the term latenzzeit (Lz), (German translation for latent time) will be used instead of the older term “quiescence.” Quiescence implies sleeping/resting inactivity, waiting for the next event. The term “latenzzeit or latent time” as used in the chemical and physical sciences describes systems to which energy is supplied without visible change in energy of system, e.g. latent heat of fusion and latent heat of vaporization. Latent is used in biological literature to imply undeveloped but capable of normal growth under proper conditions. Since there is evidence that cells between mitosis and beginning of G1 undergo biochemical and physical changes, “latenzzeit” which implies active but unseen movement toward a new condition is an appropriate term, which can be described quantitatively, and is consistent with usage in other scientific fields.
Goals of this research were to describe, quantitatively, latent time (latenzzeit) properties of colonic crypt cells of normal, Familial Adenomatous Polyposis (FAP), and adenomatous crypts. We then relate latenzzeit at each crypt position to colon crypt properties. We predicted that this comparative study of latenzzeit properties in normal, FAP, and adenomatous epithelium, will yield new information about functional role of latenzzeit in:
i. Colon crypt cell maintenance
ii. Shift of label indices in mutant crypts
iii. Development of Colorectal Cancer (CRC)
The experimental approach of our research was an analysis of rate at which latenzzeit changes along the crypt axis from crypt base to crypt top. This approach was selected because kinetic studies remain “the most general method of weeding out unsuitable mechanisms” [1]. All data used in this study were available from peer-reviewed publications, and analysis methods were standard and previously reported [2-5]. Latenzzeit was determined (see Methods) using this available data on total cell cycle times for human normal, Familial Adenomatous Polyposis (FAP), and adenomatous crypts.
The concept of latenzzeit (see footnote) is supported by several studies. For example, Potten et al. [3,4] reported that sum of the times of S, G2 and M phases for human colonic crypt cells is relatively constant but the total cell cycle time decreases along the crypt axis. Moreover, we analyzed this data [2] and found average total cycle time is five-fold higher at the base (85h or 306ks) compared to the top (16h or 58ks) of normal crypts. In FAP crypts, the decrease in total cell cycle time is even greater (eighteen-fold) between the base (240h or 893ks) and top (13h 47.9ks). This decrease in total cell cycle time was attributed to changes in a change in the time period between end of M phase and beginning of G1 phase.
Smith and Martin [6] also proposed that cell cycles of reproducing cultured mammalian cells have two states, an A or rest (“latent”) state, and a B state which incorporates conventional S, G2, and M, plus a small portion of G1 to account for pre-S activity such as DNA licensing [7]. They [6,8] also reported that sums of times of S, G2 and M phases in sibling mammalian cells were constant but total cell cycle times were variant. The cell cycle times that they reported [6,8] for the majority of different mammalian cell types fell into narrow time ranges of values that were similar to those reported for human colonic crypt cells [3,4]. Based on these and other findings a model was proposed by Burns and Tannock [9] that a “gap” period between end of M phase and beginning of G1 controls the total cell cycle time.
The G0 phase is often considered to be a period in which cells exist in a quiescent state. It is viewed as either an extended G1 phase, in which cells are not dividing or a distinct stage outside of the cell cycle. However, the existence of G0 is controversial. For example, in a study of primary carcinomas, Tay et al. [10] reported that human cancer cells are blocked in transition in G1 and are not predominantly in a G0 or quiescent differentiated state. Moreover, mathematical analysis of proliferating cells [11] demonstrated that human cell populations did not exhibit characteristics consistent with a G0.
In another study, Brooks et al. [12] described a model for cultured mammalian cell growth which incorporated a kinetic concept of two consecutively linked time “compartments” through which cells must pass in transition from end of M to beginning of B-phase (conventional G1).” Brooks et al. [12] provided additional details about transitions of cells from end of M to beginning of G1. While studies document that total cell cycle time is regulated by “gap” time, methods for quantifying this “gap-time” in human colonic crypt cells have not been reported.
Consequently, in our study, quantitative methods were developed to calculate latenzzeit of colonic cells at each position along the crypt axis and to evaluate available data on total cell cycle times for human normal, familial adenomatous polyposis (FAP), and adenomatous crypts. We selected normal, FAP, and adenomatous crypts because data were available from kinetic studies on FAP patients and because CRC development appears to progress along the lines of normal to FAP to the pre-cancerous condition characteristic of adenomatous. FAP is a hereditary colon cancer syndrome caused by inheritance of a germline mutation in the adenomatous polyposis coli (APC) gene. FAP patients typically develop hundreds to thousands of precancerous adenomatous polyps in their colon and have 100% risk for developing CRC unless a prophylactic surgery is performed to remove the colon. Half of FAP patients develop adenomas by age 15 and average age of CRC detection is 38 years [13]. Even though all cells in crypts that make up the colonic epithelium of FAP patients have a mutation in one copy of the APC gene (1st APC mutation), these crypts appear to be histologically normal. However, when FAP patients develop a mutation in the remaining wild-type APC gene (2nd APC mutation), adenomatous crypts (adenomatous) forms in the colon mucosa, multiply, and establish collections of adenomatous crypts which constitute adenomatous polyps [14-16]. These polyps are precancerous lesions, which, if not removed, can develop into CRC [13].
While FAP disease is relatively uncommon (1 in 10,000 individuals), results reported here have wider implications for understanding mechanisms involved in development of commonly occurring sporadic adenomatous polyps (1 in 2 individuals) and sporadic CRC (1 in 20 individuals) [17]. Thus, in both FAP and sporadic cases, mutations of APC genes and tumor formations are known initial and final events of CRC development [13]. While mechanistic steps between initiation and CRC formation may be the same or different in FAP and sporadic cases, descriptions of logical mechanistic steps for FAP will augment and focus companion studies of sporadic CRC development, and simultaneously, promote opportunities for discovering new disease control strategies. Because a critical part of mechanism design requires testing proposed processes with quantitative data, a useful mechanistic process for CRC development must provide logical links between quantitative data and qualitative cellular information. Hence, to identify kinetic mechanisms involved in CRC development, we calculated latenzzeit of colonic crypt cells using data on crypt cell cycle times from FAP patients who carry APC mutations.
In our study, latenzzeit (Lz) was defined as the time period that a proliferative colonic crypt cell is not in any of the classical cell cycle phases, G1, S, G2, or M. In other words, the total cell time (Tc) is equal to time of G1 + S + G2 + M + Lz, where time of G1 + S + G2 + M is the limiting cell cycle time at the crypt top [2-4]. Crypt position, “i”, was defined as the fraction along crypt axis indicating crypt cell position relative to total crypt length. Cell position at the crypt base was “i” = 0.0 and cell position at crypt top was “i” = 1.0. Thus, at any crypt position, average Lz was set equal to total cell cycle time (Tc) at that “i”(Tci)minus limiting cell cycle time (Tclim) at “i” = 1.0. Using this approach, Lz at each “i” (Lzi) was determined, in units of kilosecond (ks) for normal (NOR), FAP, and adenomatous (ADA) crypts.
We also conjectured that Lz of crypt cells is equal to sum of Lz contributions by more than one kinetic process. To evaluate this possibility, we calculated Lz by analyzing total cell cycle time (Tc) along the crypt axis using a method which has been used for analysis of parallel first order chemical reactions [18] and resolving decay curves on radiochemical [19] reactions. Computed Lzi results were then compared with neither quantitative physiological properties of NOR, FAP, and ADA colon crypts such as fraction of proliferative cells, FPR, probability of crypt cells being in S-phase, PS, and positions of LI maxima [2].
For calculating Lz in normal crypts, average Lzi(TciNOR), equals Tci minus Tclim, where TclimNOR is Tc (56.5 ks) at the NOR crypt top (Equation 1) [2-5]. Thus, we assumed that TclimNOR is equal to sum of time of S (TS), G2(TG2), M (TM) phases, plus part of TG1 required for preparation of entry into S phase (e.g. DNA synthesis licensing). Average FAP crypt cell Lzi(Lzi FAP) equals Tci FAP minus TclimFAP (47.9 ks) at crypt top (Equation 2).
LZiNOR=TciNOR-TclimNOR=TciNOR-56.5 ks (Equation 1)
LZiFAP=TciFAP-TclimFAP=TciFAP-47.9 ks (Equation 2)
A neither plot of Lzi NOR was not linear rather it had exponential characteristics (data not shown). Logarithmic plots of Lzi (ln[Lzi]) for NOR and FAP (Figure 1) were not linear, suggesting that these Lz curves are comprised of several components. Hence, we used the method (described above) to resolve components in these curves [18,19]. This analysis showed that while the ln [Lzi NOR] plot (Figure 1) was not linear from “i” = 0 to 0.5, it was linear from “i” = 0.50 to 1.0 (R2> 0.99). To determine if Lzi NOR contained other linear components, values for the “a-line” calculated from (Equation 1), were subtracted from Lzi NOR values. This subtraction provided a set of values for Lzi NOR without contribution of the “a-line” values (L(z-a)i NOR). The plot of ln[L(z-a)i NOR] was not linear from “i” = 0 to 0.15, but it was linear from “i” = 0.15 to 0.35 (R2> 0.99), which was designated as the “b” line NOR. In a similar manner, both “a-line” NOR and “b-line” NOR were subtracted from Lzi NOR. This subtraction provided a set of values for L(z-a-b)i NOR, that is, Lzi NOR without contributions of either “a-line” NOR or “b-line” NOR. The plot of ln[L(z-a-b)i] NOR values vs. “i” was linear in positions 0 to 0.06 (R2> 0.98), which was designated as “c” line NOR. Correlation of ln[Lzi] NOR] (Figure 1) at each “i” with corresponding ln[(“a-line” NOR + “b-line” NOR + “c-line” NOR] had an R2> 0.99. Analysis of Lzi FAP data (Figure 1) by the method neither described for NOR gave similar results. That is, correlation of ln[Lzi] FAP at each “i” with ln [“a-line FAP” + “b-line FAP” + “c-line”] FAP at each corresponding “i” had an R2> 0.98. Because TS was used in the published calculation of both Tci and Tclim[2], possible variability in reported TS was of concern. Accordingly, Lzi NOR and Lzi FAP were re-calculated using reported [3,4]limiting TSvalues of 22 ks and 54 ks, and what is considered as best estimate, 32 ks.
Lzi ADA values were estimated from a published report [5] listing fractions of S cells at each “i” (FSi). From these data, an equation was derived for fraction proliferative cellsat each “i”(FPRiADA); (Equation 3). Derivation of Equation 3 was based on assumptions that its mathematical form was similar to equations for FPR i NOR (J = 6.952), and FPR i FAP (J = 5.248) [2-5] and the requirement that FPR i ADA was greater than Fs i ADA at all “i.” In Equation 3, J ADA = 1.81 and “i” is crypt position.
Equation 1 :
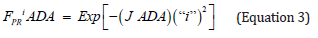
For ADA, probability of cells at crypt position “i” being in S (Ps i ADA) was calculated from the quotient (Fs i ADA)/ (FP Ri ADA) [5]. Cell cycle time, Tc i ADA, was set equal to the quotient TS/(Ps i ADA) [5]. Using these previously described relationships [5] with TS = 32 ks, PS lim ADA (crypt position “i” = 1.0) was 0.91 corresponding to Tc lim = 35 ks (compare with Tc limFAP = 47.9 ks, and Tc lim NOR = 56.2 ks). Relationships used for ADA calculations were identical to those used for NOR and FAP data analysis. Lzi ADA values were calculated using Equation 4.
Lzi ADA = TciADA-35 ks (Equation 4)
Plot of ln[LziADA] vs. “i” was linear in positions “i” = 0.43 to 1.00 (Figure 3). In crypt regions “i” = 0 to 0.43, FS ADA were less than detection limit of FS = 0.0015 [2-5], therefore ln[LziADA] at positions “i” = 0 to 0.43 were assumed to be greater than 9.98. Thus, positions “i” = 0 to 0.43 Lzi ADA were assumed to be greater than 2.2 E4 ks. The correlation of ADA line (Figure 3) had an R2 = 0.972.
Previously reported crypt positions of LI maxima of NOR and FAP [2-4] at “i” = 0.19, and “i” = 0.25, respectively were used. Crypt positions of LI maxima value for ADA was reported [5] at “i” = 0.93.
AUC FPR i NOR vs. “i” was estimated by summation of the quotients, (FPR iNOR) (0.0126), from “i” = 0 to 1.0.In this calculation, the constant 0.0126 represented increment of change in “i” between each succeeding FPRi value. Likewise, AUC PR i FAP vs. “i”, was estimated by summation of quotients (FPR iFAP) (0.0126), from “i” = 0 to 1.0. AUC PR i ADA vs. “i” was estimated by summation of quotients (FPR iADA) (0.050) from “i” = 0 to 1.0 where constant 0.0150 represented increment of change in “i” between each succeeding FPR i ADA value.
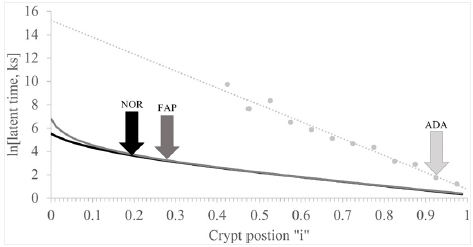
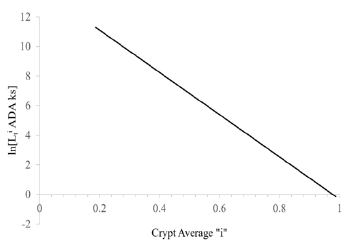
A logarithmic plot of latenzzeit versus crypt position of normal and FAP colonic data is non-linear, but the logarithmic plot of adenomatous crypt data is linear. The plots of ln[Lzi NOR], ln[Lzi FAP], and ln[Lzi ADA] (Figure 1) illustrate substantial differences between NOR, FAP and ADA. The plots for NOR and FAP colonic data are non-linear, but the plot of ADA crypt data is linear. These plots of ln[Lzi ]NOR and ln[Lzi ] FAP indicate that decreases in Lzi along axes of NOR and FAP crypts are not controlled by simple first order processes. In contrast, plot of ln[Lzi] ADA (Figure 1 ) provides quantitative evidence that decrease of Lzi along ADA crypt axes is controlled by a single first order mechanism and suggests that the 2nd APC mutation (in addition to association with a large increase in Lz0 ADA compared to Lz0 FAP) changes mechanism(s) controlling decrease in Lzi ADA. Latenzzeit also explains how total cell cycle time is controlled in crypts. In NOR, FAP and ADA crypts, the decrease in total cell cycle time along the crypt axis can be attributed to decrease in Lz from crypt base to top.
Positions of LI maxima (arrows) and Y-axis intercepts (Lz0) for NOR, FAP, and ADA (Figure 1). The Lz0 values represent ln[Lzi] of cells at base of crypts (“i” = 0) and were equivalent to 252 ks (NOR), 864 ks (FAP), and 3.37 E6ks (ADA). This demonstrates that shifts of LI maxima positions from “i” = 0.19 (NOR) to “i” = 0.25 (FAP) to “i” = 0.95 (ADA), may be related to Lz0 of FAP, and ADA crypts.
Figure 1 : Latent time profiles of normal (NOR), familial adenomatous polyposis (FAP) and adenomatous (ADA) colon crypts are shown. These plots show, natural log (ln) of latent times at each crypt neither position “I” (y-axis) of NOR (black), FAP (dark gray), ADA (light gray), and the crypt position “i” as fraction of total crypt length (x- axis). Arrows neither indicate position of labeling index maxima (LImax) of S-phase cells for NOR (black) at “i” = 0.19, FAP (gray) at “i” = 0.25, and ADA (light gray) at “i” = 0.91. ADA trend line r2= 0.997.
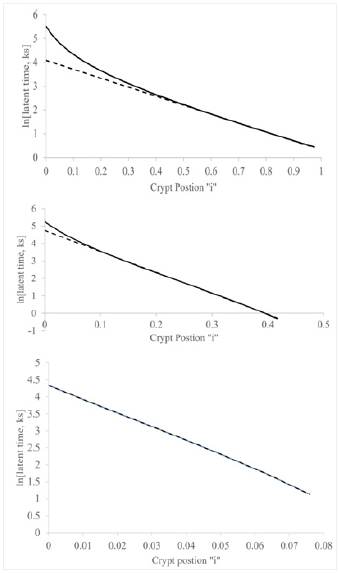
Our approach to resolve components of the NOR curve (see NOR line in (Figure 1)) is illustrated in (Figures 2) A, B, C. In Figure 2, linear portion of the ln[Lzi ] NOR vs. “i” plot (Figure 1) was drawn from “i” = 0.5 to 1.0 and then back extrapolated to “i” = 0. Equation of this “a-line” NOR, (Table 1) allowed calculation of ln[Lzi] “a-line” NOR values at each “i” from crypt base, “i” = 0, to crypt top, “i” = 1.0. Subtraction of “a-line” NOR values from ln[Lzi] NOR line (Figure 1), gave a set of values L(z-a)I that did not include any “a-line” Lzi contributions. This set of L(z-a)i values was then plotted vs. “i” (Figure 2). Thus, Figure 2 was equal to (Figure 1) (NOR) curve minus “a-line” shown (Figure 2).
Figure 2 : Analysis of latent time normal (NOR) data to determine the “a-, b- and c- line” equations.
Panel A illustrates analysis of latent time normal (NOR) data to discover the “a-line” equation. Plot of natural log (ln) NOR latent time (y-axis) vs. crypt positions “i” given as fraction of total crypt length (x- axis) is shown (solid). The linear portion of this plot from “i” = 0.5 to “i” = 1.0, the so-called “a” -line, is shown as an extension to “i” = 0 (dashed). Equation of “a-line” was determined by standard regression analysis (Table 1).
Panel B illustrates analysis of latent time of normal (NOR) data to discover the “b-line” equation. Latent time values resulting from subtraction of neither “a-line” NOR latent time values at each crypt position from latent time NOR values at each corresponding crypt positions, were plotted as ln [latent time NOR - “a-line” NOR] vs. “i” (solid). Linear portion of this plot from “i” = 0.15 to “i” = 0.35, the so called “b-line,” is shown as an extension to “i” = 0 (dashed). Equation of “b-line” was determined by standard regression analysis (Table 1).
Panel C illustrates analysis of latent time of normal (NOR) data to discover the “c-line” equation. Latent time values resulting from subtraction of both “a-line” NOR and “b-line” NOR latent time values at each crypt position from latent time NOR values given in Figure 1, at each corresponding crypt positions, were plotted as ln[latent time NOR - “a-line” NOR - “b-line” NOR] vs. “i” (solid). The linear portion of this plot from “i” = 0 to “i” = 0.08, the so-called “c-line,” was extended to “i” = 0 (dashed). Equation of “c-line” was determined by standard regression analysis (Table 1).
The plot in Figure 2 was not linear from “i” = 0 to “i” =1.0 but was linear from “i” = 0.15 to 0.35 (“b-line” NOR). Equation of “b-line” NOR (Table 1) allowed calculation of “b-line” L(z-a)i NOR values at each “i” from crypt base to crypt top. Subtraction of “a-line” NOR and “b-line” NOR values from ln[Lzi] NOR line (Figure 1), gave a list of L(z-a-b)i values which included neither “a-line” Lzi nor “b-line” Lzi NOR contributions. This list of L(z-a-b)i values was plotted vs. “i” (Figure 2). Thus, Figure 2 was equal to Figure 1 (NOR) curve minus both “a-line” shown in Figure 2 and “b-line” (Figure 2). Figure 2 was linear (R2 = 0.993) from “i” = 0 to “i” = 0.08. Equation for neither “c-line NOR (Table 1). Finding that the logarithmic plot of latenzzeit versus crypt position is equal to sum of three lines shows that latenzzeit has three components (slow, medium fast) and indicates that, in normal crypts, latenzzeit is regulated by three sequential, first order kinetic processes. A similar plot of FAP data was nonlinear and equal to sum of three lines, but slopes and intercepts for FAP data were not equal to results for NOR crypts. Thus, in FAP, latenzzeit also appears to have three components (slow, medium fast) and indicates that latenzzeit is regulated by three sequential, first order kinetic processes, but the data indicate these processes are modified compared to normal crypts.
The equations and results on slopes and Y-axis intercepts for “a-,” “b-,” “c-lines” (Table 1). These equations provided slope of each line, equivalent to rate at which ln[Lzi] “a-line”, ln[Lzi] “b-line”, etc. values change with change in “i” and the Y-axis intercept of each line that is equivalent to ln[Lz0] “a-line”, ln[Lz0] “b-line”, etc. For example, ln[Lz0] of NOR “a-,” “b-,” and “c-lines (data at Ts = 32 ks) were equivalent to 58.6 ks, 113, ks and 79.0 ks, respectively. Results from analysis of ln[Lzi] FAP and ln[Lzi] ADA (Table 1). Comparisons of equations for “a-,” “b-,” and “c-line” NOR and FAP demonstrate that corresponding slopes and intercepts of NOR and FAP “a-,” “b-,” and “c-lines” are different. Slopes of “a-line” NOR and “a-line” FAP, -3.74 ks-1, and -2.15 ks-1, respectively, are similar and approximately four times smaller than slope of ADA line (-14.1 ks-1). Slopes of “c-line” NOR and “c-line” FAP, -39.3 ks-1 and -56.7 ks-1 respectively, are similar and approximately four times larger than ADA line slope (-14.1 ks-1). In neither contrast, “b-line” NOR slope (-11.8 ks-1), and “b-line” FAP slope (-10.7 ks-1), are similar and, additionally, similar to ADA line slope (-14.1 ks-1). From these data, we conclude that “b-line” NOR, “b-line” FAP, and ADA-line slope control processes are similar, but different than, and independent of, “a-” and “c-line” slope control processes in NOR, and FAP, and that “b-line” process, compared to “a-,” and “c-line” processes, are relatively unaffected by 1st and 2nd APC mutations.
Table 1 : *Lists equations of “a-,” “b-,” and “c- lines” for normal (NOR) and familial adenomatous (FAP), and equation for the FAP adenomatous (ADA) line. Each equation provides slope and the y-axis intercept of the line. Since S-phase time, TS, is used in calculations of these equations, and since there is considerable range in reported TS values, we have listed equations calculated using three reported TS values, 22 ks. 32 ks, and 56 ks. In all comparisons of slope and intercepts in this report, we used equations calculated at TS = 32 ks.
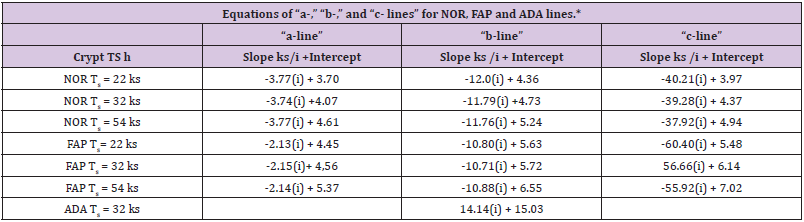
Y-axis intercepts (Lz0) of “a-,” “b-,” “c-lines” FAP are larger than corresponding Lz0 values of NOR crypts with ratios of 1.63. 2.69, 5.87, respectively, and attributed to APC mutation. And sum of Lz0 values for “a-,” “b-,” and “c-lines” FAP, (95.7ks + 305ks + 464ks = 865ks) was about 3.4-fold greater than sum of Lz0 values for “a- ,” “b-,” and “c-lines” NOR (58.6 ks + 113ks + 79.1 ks = 251 ks). From these data, we concluded that the relatively small difference between Lz0 value NOR, 250 ks, and Lz0 value FAP, 865 ks, resulted from cellular kinetic processes that are just moderately affected by the 1st APC mutation. In contrast, the large difference between Lz0ADA, 3.37 E6 ks, and Lz0 FAP, 865 ks, indicates that that 2nd APC mutation resulted in a substantial change in mechanism(s) controlling Lz0 ADA. This interpretation of Lz0 data is consistent with the interpretation that latenzzeit in NOR and FAP crypts is regulated by three first order kinetic processes while latenzzeit in ADA crypts is governed by a single first order process. While ADA line appears to be controlled by a single kinetic process, we could not determine from available data if 2nd APC mutation had eliminated “a-” and “c-line” contributions to Lz0ADA, or if 2nd APC mutation produced such a large increase in only “b-line” ADA that “a-” and/or “c-line” contributions to Lz0 ADA were just minimized so they were masked.
Figure 3 : This figure illustrates change in latent time values at each “i” Lzi, of adenomatous crypt cells (ADA) with change in crypt position “i”. Values of latent time ADA were plotted as natural log, ln [latent time ADA] (y-axis) vs. crypt position “i” given as fraction of total crypt length (x- axis), is shown. Equation of ADA line was determined by standard regression analysis (R2 = 0.974) (Table 1).
The plot illustrates the 1st order decrease of ln[Lzi] ADA with increasing values of “i” along the ADA crypt axis (Figure 3). The equation for this ADA line (Table 1). Fraction of S-phase labeled cells from “i” = 0 to “i” = 0. 32 were below detection limit [5], so ln[Lzi] ADA from “i” = 0 to “i = 0.32 was assumed to be greater than 9.7.Notably, the slopes of “b-line” NOR (11.8 ks-1), “b-line” FAP (10.7 ks-1), and ADA line (14.1 ks-1) are similar. But compared to NOR and FAP, this logarithmic plot of ADA crypt data, being linear, shows two of the latenzzeit components (slow & fast) are lost and one (medium) component is retained in ADA crypts. From these data we concluded that “b-line” NOR, “b-line” FAP, and ADA-line slope control processes that are similar, but different than, and independent of “a-line“ and “c-line” slope control processes in NOR, and FAP. Quantifying latenzzeit in FAP (Figure 1) and ADA crypts (compared to NOR crypts)provides a measure of the effects of APC mutations in CRC development. In FAP crypts, heterozygous APC mutation modifies latenzzeit by affecting all three kinetic processes. In contrast, the plot of ln[Lzi] ADA vs “i” provides quantitative evidence that decrease of Lzi along ADA crypt axes is controlled by a single first order mechanism and supports the concept that a 2nd APC mutation, compared to Lz0 FAP, also changes mechanisms controlling decrease in Lziin ADA crypts. Thus, in adenomatous (ADA) crypts, homozygous mutant APC modifies latenzzeit through loss of two kinetic processes and modification of the third kinetic process. The changes of latenzzeit in neoplastic, mutant crypts also explain a mechanism for the progressive lengthening of the total cell cycle time along the axes of FAP and adenomatous crypts.
Figure 4 : This figure illustrates change in fraction of proliferative cells, FPR, (y-axis) for normal (NOR; solid line), Familial Adenomatous Polyposis (FAP; dotted line), and adenomatous (ADA; dashed line) crypts vs. crypt position “i” (x-axis).
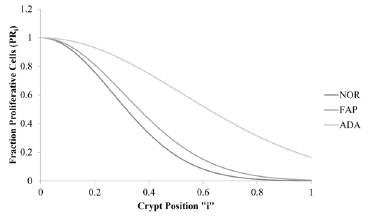
The plots illustrate that the crypt property, fraction of
proliferative cells (FPRi), decreases with change in “i” along the
crypt axis for NOR, FAP, and ADA (Figure 4). Total areas under these
curves (AUC) increase in order NOR< FAP<
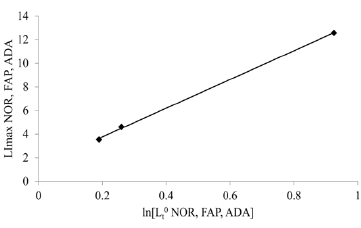
This figure 5 illustrates the relationship between “shift” of LI maxima positions, a colon crypt property, and the colon crypt cell property, Lz0 (Figure 5). With increasing values for ln[Lz0]NOR, to ln[Lz0]FAP, toln[Lz0]ADA, positions of LI maxima of NOR, FAP, ADA crypts shift to larger “i.” This also demonstrates that shifts of LI maxima positions from “i” = 0.19 (NOR) to “i” = 0.25 (FAP) to “i” = 0.95 (ADA), may be related to increased Lz0 values for FAP, and ADA data.
Figure 5 : This figure illustrates correlation of LImax of normal (NOR), Familial Adenomatous Polyposis (FAP), and adenomatous (ADA), crypts (y-axis), (p< 0.05; R2 = 0.997) (y-axis) with latent times, Lz0, of cells at base (“i” = 0) of corresponding crypt type.
The Y-axis intercept value of ln[Lzi] NOR appeared to be the origin of a contiguous set of ln[Lzi] NOR crypt cell values at each succeeding “i” along the NOR crypt axis. Similarly, ln[Lz0] FAP and ln[Lz0] ADA appeared to be origins of contiguous sets of Lzi FAP and Lzi ADA crypt cell values at each succeeding “i” along the FAP and ADA crypt axes. From these data, we concluded that differences between ln[Lz0] values of NOR compared to FAP, and of FAP compared to ADA, provided quantitative measures of changes in crypt cell property, Lz0, resulting from 1st and 2nd APC mutations, respectively. While Lz0 values provided information about FAP, and ADA crypt properties, they did not provide mechanistic information about how, for example, 1st APC gene mutation resulted in a 3.4-fold increase in Lz0FAP compared to Lz0 NOR.
That LI maxima positions for NOR, FAP, and ADA (Figure 5), (p < 0.05; R2 = 0.9958) correlate with corresponding crypt cell property Lz0 supports our conclusion that 1st and 2nd APC mutation initiated changes in Lz0 values, result in “shift” of LI maxima positions, a colon crypt property considered by some to be an indicator of CRC development. This raises the question “what mechanisms might explain these observations. Two possible mechanisms we considered bear some discussion. A “three-cell model,” while attractive, required that at NOR crypt cell position “i” for example, three cells, “a,” “b,” and “c,” consecutively add their Lz to produce an average cell with Lz of cell at position “i” (Figure 1). This “three cell” mechanism requires a very large number of error free, integrated steps, including proper orientations of cells, over the lifetime of the crypt. A more plausible timing model is one in which three sequentially linked chemical and/or genetic “clock reactions” are within one “compartment” because fewer error free steps are required, and cell-cell orientations are not required.
Currently, development of CRC is attributed to “over population of cancer stem cells” and expansion of the so-called “stem cell compartment.” [2,20-23]. However, these qualitative descriptions provide neither an opportunity to neither predict site of dysfunctions nor test critical relationships between properties of cells located in the “stem cell compartment” and development of CRC. Plots of ln[Lzi] vs. “i” for crypt cells (Figure 1) demonstrates that cells with longest Lz reside nearest base of crypts, the area generally believed to be populated with “stem cells.” FAP crypts, formed after 1st APC mutation, demonstrate an increase in the population of cells with increased Lz. That is, the “compartment” of long latent time crypt cells is larger in FAP compared to NOR, and with advent of 2nd APC mutation, the “compartment” of long latent time crypt cells is larger in ADA, compared to FAP, by a factor of more than 2000. We have, reported here values of average Lz of at each “i” for NOR, FAP, ADA crypts and believe these values describe Lz properties of, so-called, “stem cells” and “cancer stem cells.” In addition, we have provided values for FPR in NOR, FAP, and ADA which adversely impact kinetic properties required for normal crypt function. Thus, data presented here suggests that mechanism of CRC development is the step-wise (NOR to FAP to ADA) increase in Lz of cells, which is considered it be the time period between end of M and beginning of G1. An increase in Lz explains a mechanism for how the total cell cycle time becomes increased in FAP and ADA crypts.
Our study represents one of the first efforts to study latent time (latenzzeit) mechanisms involved in the development of CRC. We studied FAP because this hereditary disease serves as a genetic model to study development of this malignant disease in patients. We report here latenzzeit values corresponding to:
(i) The base of the colonic crypt,
(ii) Rate of change along the crypt axis,
(iii) Associated kinetic processes and alterations during CRC development. In our analysis of logarithmic latenzzeit plots, we show that slopes and intercepts differ between normal, FAP and adenomatous crypts which gives us information on how APC mutations affect latenzzeit ofcolonic crypt cells. Taken together, our results also shows that mathematical analysis and modeling can give us important insight into mechanisms that are involved in development of disease processes, such as cancer.
In conclusion, our findings from analysis of Lzi data, as provided in this report, indicate that LI-shift of colon crypt cells, which is an indicator of CRC development, and Lz0 of crypt cells, results from increased Lz0 of crypt cells. The significant correlation of Lz0 values for NOR, FAP, ADA crypt cells and the LI-shift of colon crypts suggests that formation of ADA crypts, and fully developed adenomatous polyps, results from an increase in Lz0 value caused by APC mutation during CRC development. An increase in Lz0 will
(i) Reduce the maturation of colon crypt cells,
(ii) Increase the fraction of proliferative cells along crypt axis,and
(iii) Increase probability of formation of adenomatous polyps and CRC. Thus, latenzzeit regulatory mechanisms appear to be essential for crypt maintenance and, when altered, contribute to development of CRC.
We acknowledge financial support by Hamline University and advice of Professor Wojicech Komornicki.


