info@biomedres.us
+1 (502) 904-2126
One Westbrook Corporate Center, Suite 300, Westchester, IL 60154, USA
Site Map

Received: July 18, 2017; Published: July 31, 2017
Corresponding author:Tim Idzenga, Erasmus Medical Center, Department of Urology, PO BOX 20403000 CA Rotterdam, Netherlands
DOI: 10.26717/BJSTR.2017.01.000239
Objectives: The current standard method for diagnosing bladder outlet obstruction in patients with Lower Urinary Tract Symptoms (LUTS) is a pressure-flow study. Electronic perineal auscultation, i.e. recording sound with a contact microphone behind the scrotum during voiding, might be an easy-to-use non-invasive alternative. Of major importance for the clinical applicability of perineal auscultation is the quality of the sound recording.
Methods: In a clinical population of 74 male LUTS patients we studied two measures for assessing the quality of electronic perineal auscultation: a Normalized Correlation Coefficient (NCC) and Signal-To-Noise Ratio (SNR). We compared these measures with the visual assessment of the electronic auscultatory signal by three experienced observers. The agreement between the experienced observers was expressed using the Weighted Kappa statistic. Both quality measures were compared to the combined visual assessments using the Kruskal Wallis test and the usefulness was evaluated using ROC-analysis.
Results: The Weighted Kappa values between the three observers were 0.73, 0.66 and 0.76 (p<.05).For recordings classified as ‘good’ by the observers, the NCC was significantly higher than for the ‘medium’ and ‘poor’ quality recordings (p<.05). The areas under the ROC curve were 0.84 and 0.66 (both significant, p<.05) for NCC and SNR, respectively.
Conclusion: We developed quality criteria to assess the quality of electronic perineal auscultation in patients with LUTS. These quality measures can be used to select auscultatory measurement signals that are suitable for further analysis and for improving the perineal auscultation setup.
Keywords: Bladder outlet obstruction; Noninvasive; Normalized cross correlation; Perineal auscultation; Quality measure
Abbreviations: LUTS: Lower Urinary Tract Symptoms; NCC: Normalized Correlation Coefficient; SNR: Signal To Noise Ratio; BPE: Benign Prostatic Enlargement; BOO: Bladder Outlet Obstruction; LUTS: Lower Urinary Tract Symptoms; PFS: Pressure-Flow Study; VUDE: Video Uro Dynamic Examination; NCC: Normalized Correlation Coefficient; SNR: Signal-To-Noise Ratio; ROC: Receiver Operator Characteristic; NOW: Netherlands Organization for Scientific Research
In men the prostate generally increases in size with age, most often as a result of Benign Prostatic Enlargement (BPE). The latter may lead to Bladder Outlet Obstruction (BOO). Men with BOO generally have Lower Urinary Tract Symptoms (LUTS), including a weak urinary stream, frequent voiding (also nocturnal) and residual urine in the bladder after voiding. The current standard method for diagnosing BOO is a pressure-flow study (PFS) which is part of a (video) urodynamic examination (VUDE). The pressure flow study consists of a urinary flow measurement while simultaneously recording the detrusor pressure using a catheter inserted in the bladder and a second catheter in the rectum. This method is timeconsuming, costly, uncomfortable to the patient and potentially harmful (it may lead to serious side-effects).This poses a threshold for preoperative testing. To lower this threshold, easy-to-use noninvasive urodynamic testing methods have been developed such as the Doppler flow metry method [1], the condom-catheter method [2], the penile cuff method [3], bladder wall thickness measurement [4] and most recently perineal auscultation [5-6]. All of these methods have some drawbacks. The latter technique records the sound generated by the urinary flow through the urethra with a perineal contact microphone. In a model of the urethra it was shown that the sound, recorded downstream of an obstruction is related to the degree of obstruction [5]. The variability and repeatability of perineal auscultation has been studied in a male volunteer population [6]. In the latter study the authors found that the results were significantly different between volunteers.
The quality of the sound recording is of major importance for the clinical applicability of perineal auscultation. Disturbances of the recording by e.g. movement of the microphone or noise from the surroundings can affect the results and thereby the diagnosis. To establish whether a measurement may result in a correct diagnosis objective quality measures are required. We studied two measures for assessing the quality of perineal auscultation in a clinical patient population, and compared these quality measures to the visual quality assessment of measured traces by three independent experienced observers.
74 male patients who were referred to the Department of Urology of Erasmus MC, Rotterdam, for a VUDE between May 2008 and May 2012 were included. Typical complaints were incontinence and bladder evacuation problems. The local Medical Ethical Committee approved the study protocol.
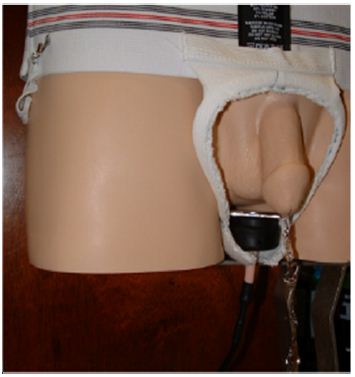
Figure 1:Modified jockstrap to fix the microphone at the perineum during voiding.
The quality of the perineal auscultation was assessed using two different approaches. The first was an independent visual scoring of the quality by three experienced observers and the second approach was signal analysis by two objective measures. The two approaches were performed independent from each other. In the first approach the flow and sound signal were visually inspected by the three observers, blinded for each other’s scoring. The quality of the recordings was scored using a three-point scale: ‘good’=1, ‘medium’=0 and ‘poor’=-1. Examples of sound signals of good, medium and poor quality are shown in (Figure 2). Good quality signals had low noise levels and sound amplitude that increased and decreased synchronously with the flow rate signal (Figure 2). Medium quality signals had increased noise levels but still had a perceivable amplitude variation of the auscultatory signal synchronously with the flow rate signal (Figure 2 middle). All other measurements were scored as poor.
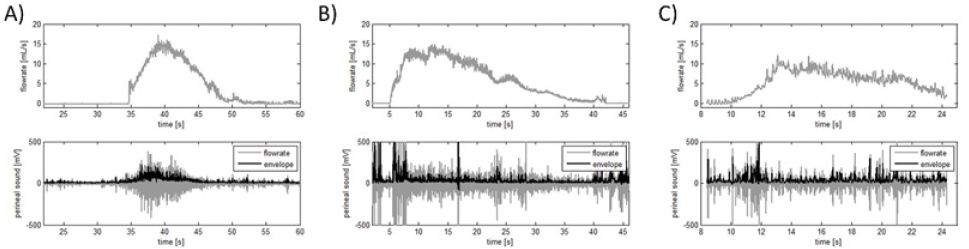
Figure 2:Examples of a ‘good’ (A), ‘medium’ (B) and ‘poor’ (C) sound flow measurement. The ‘good’ perineal sound signal (bottom left) is plotted grey and its envelope is colored black. The envelopes have the same pattern as the flow rate signal (top left), i.e. before and after voiding both signals are relatively low. During voiding both envelope and flow rate ascend and descend.
In the second approach, the quality of each auscultatory recording was quantified using two objective measures. The first measure was based on the normalized correlation coefficient (NCC) between the auscultatory signal and the flow rate signal. From each recording a time interval (flow rate higher than half the maximum flow rate) during voiding was manually selected. The correlation between the envelope of the selected auscultatory signal and the associated flow rate was calculated using normalized cross correlation, where 1 indicated maximum correlation and 0 no correlation. The envelope of the auscultatory signal was obtained by band pass filtering the signal between 25 to 500 Hz, followed by a Hilbert transformation, rectification of the transformed signal and subsequent low pass filtering at 20 Hz. The envelope was then shifted0.1 seconds with respect to the flow rate signal and the NCC was calculated again. The correlation was calculated for all time delays between ± 2 seconds. The maximum correlation coefficient was selected and used to assess the quality of the measurement.
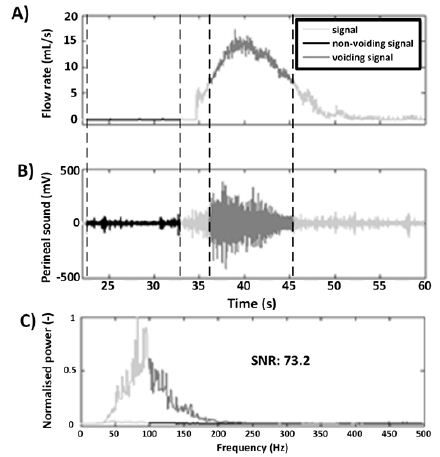
Figure 3:An example of processing a sound flow measurement. The flow rate (A) and perineal sound (B) are plotted as a function of time. The non-voiding interval and voiding interval are plotted black and dark grey, respectively. The calculated normalized frequency spectra (C) are plotted using the same colors. The Signal-to-Noise Ratio was obtained by dividing the areas under the curves.
The second measure was based on the signal-to-noise ratio (SNR) of the auscultatory signal. This SNR was calculated by manually selecting two intervals within the earlier selected interval for calculating NCC: a voiding interval and a non-voiding interval (Figures 3a-3b). Selection of the voiding interval was computer assisted by automatically indicating the part of the flow rate signal higher than half the maximum flow rate. The non-voiding interval was selected based on absence of flow and a low sound level. The SNR was calculated based on the method that was previously described in detail by Idzenga [6]. In the voiding and non-voiding interval we calculated the power spectra of the sound signal in a window of 0.8s duration using Fast Fourier Transform. The window was then moved 0.2s and the spectrum was calculated again. This procedure was repeated until the end of the selected time interval was reached. The frequency spectrum in the frequency range 100 - 500 Hz was averaged over the time windows, resulting in an average voiding and non-voiding spectrum. The SNR was calculated by dividing the areas under the curves of these two averaged spectra (Figure 3c).
The agreement between the three observers was expressed using the Weighted Kappa statistic [8],where 1 is perfect agreement, 0 is what would be expected by chance, and negative values indicate agreement less than pure chance. When the observers disagreed we used the median of the three observations as combined quality score. The objective quality scores were compared to the objective quality measures using the Kruskal Wallis test. We used Receiver Operator Characteristic (ROC) analysis to determine the performance of NCC and SNR for quantification of the measurement quality.
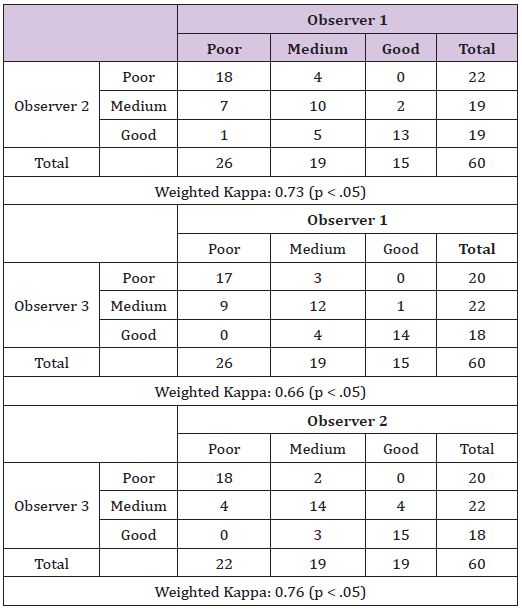
Table 1:The scoring of the three observers and the inter-observer agreement of the visual quality score are presented.
The median (min-max) age of the 74 patients included in the study was 68 (27 - 82) yrs. The recordings failed in 5 patients due to technical errors. In 9recordings there was no non-voiding interval, making it impossible to calculate the SNR. The median (25% - 75%) flow rate of the remaining 60 recordings was 11.9 (8.3 - 18.6) ml/s and the median (25% - 75%) voided volume was 80 (50 - 152) ml. The scoring of the three observers and the interobserver agreement of the visual quality score are presented in (Table 1). All three Weighted Kappa values, 0.73, 0.66 and 0.76, were significantly different from 0 (p < .05). The medians of the quality scores as assessed by the three observers were distributed as follows: of the 60 recordings 21 were scored as ‘poor’ quality, 23 as ‘medium’ quality and 16 as a ‘good’ quality recording.
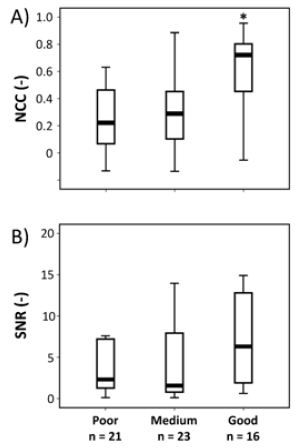
Figure 4:Box plots of the two quality parameters, i.e. NCC (A) and SNR (B), for the three visual quality scores as assessed by the experienced observers. *The NCC of the good quality recordings was significantly different (p < .05) from that of the poor and medium quality recordings.
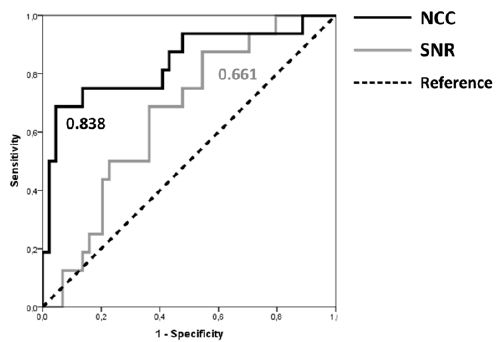
Figure 5:ROC curves with the AUC values for the quality measures NCC and SNR.
The NCC and SNR for the three visual quality scores are depicted in (Figure 4). The NCC for the good quality recording was significantly different from that for the medium and poor quality recordings (Kruskal-Wallis, p < .05). The 25th and 75th percentile of the NCC were 0.45 and 0.80 for the good quality, 0.10 and 0.45 for the medium quality and 0.07 and 0.45 for the poor quality recordings. The SNR was not significantly different (Kruskal-Wallis, p = 0.13) between the quality scores. The ROC curves for the two quality measures are depicted in (Figure 5). For the ROC analysis the poor and medium recordings were grouped, since the NCC values were significantly higher for the good quality recordings. The areas under the curve were 0.84 and 0.66 (both significantly different from the reference line, p < .05) for NCC and SNR, respectively.
A good quality recording is essential for clinical use of perineal auscultation to noninvasively diagnose BOO in patients with LUTS. In this paper we tested two objective measures for quantifying the quality of perineal auscultation recordings. To test the validity of these quality measures we compared both to quality scores visually assessed by three experienced observers. The NCC best reflected the assessment by the three experienced observers. According to the commonly cited scale for the Weighted Kappa statistic [8,9] the experienced observers were in substantial agreement on scoring the quality of the recordings. This supports the use of their scoring as a ‘gold standard’ for validating the two quality measures. These quality scores were evenly distributed over the patient population, i.e. each quality score was assigned to an approximately equal number of patients (Table 1), which makes this population suitable as a test population.
When comparing the two quality measures to the quality scores, the NCC was significantly higher for the good quality recordings than for the medium and poor quality recordings. This was not the case for the SNR, which makes the latter measure not suitable for distinguishing good quality from medium/poor quality recordings. Also the area under the ROC curve was higher for NCC than for SNR. This suggests that NCC represents the quality scoring by the experienced observer’s best. Computing the NCC for an auscultatory recording however is not completely objective. NCC contains a semi-objective element in the sense that for each perineal auscultatory recording a certain time interval was selected manually. This time interval defines the onset and ending of voiding and was used to remove distortions when the patient moved before or after the voiding. Based on the 25th and 75th percentile of the NCC for good and medium quality recordings we propose a suitable cutoff NCC-value to identify good quality auscultatory recordings of 0.45.
In conclusion, we developed quality criteria to assess the quality of electronic perineal auscultation in patients with LUTS. These quality measures can be used to automatically select auscultatory signals that are suitable for noninvasively diagnosing BOO. Based on our results it would seem possible that using our present improvised setup maximally 16/60 patients could have been diagnosed noninvasively using perineal auscultation. Improvements in the setup seem necessary to increase this rate.
There are no conflicts of interest to report. This work was supported by the Technology Foundation STW, applied division of the Netherlands Organization for Scientific Research (NWO) and the technology programme of the Ministry of Economic Affairs (RKG.5640).
None of the contributing authors have any conflict of interest, including specific financial interests or relationships and affiliations relevant to the subject matter or materials discussed in the manuscript.


