info@biomedres.us
+1 (502) 904-2126
One Westbrook Corporate Center, Suite 300, Westchester, IL 60154, USA
Site Map

Received: June 08, 2017; Published: June 19, 2017
Corresponding author: Hossain Uddin Shekhar, Department of Biochemistry and Molecular Biology, University of Dhaka, Dhaka-1000, Bangladesh
DOI: 10.26717/BJSTR.2017.01.000144
Unlike the transcriptome, quantification of the proteome still requires the development of special strategies. Transcriptomics platforms such as microarray- and RNAseq-based approaches are designed to uncover the information at the transcriptome level that in turn shapes the proteome to carry out the functional cellular processes. Since most of the biological processes are controlled by proteins, it is important to quantitatively measure proteome alterations in varying conditions to mechanistically understand how cellular processes are carried out. Within the last decade mass spectrometry increasingly became the method of choice for proteome analyses and now also provides a solid platform for its accurate quantification. The aim of quantitative proteomics is to obtain reliable quantitative information about all the proteins that fall within the mass spectrometric dynamic range.
Protein analysis is often performed by conventional techniques such as staining of gel-separated proteins or antibody-based methods. With the emergence of the post-genomic and systems biology era there is a paradigm shift from targeted studies involving specific proteins to a more global proteome analysis encompassing all proteins expressed in a certain condition (“omics approach”). Such large scale or global proteomic studies aim at the identification and quantification of altered biological pathways of entire cellular systems in the chosen experimental condition with an unbiased approach. For accurate characterization of the proteome mass spectrometry (MS) is the method of choice since this technique provides molecular specificity and high sensitivity [1].
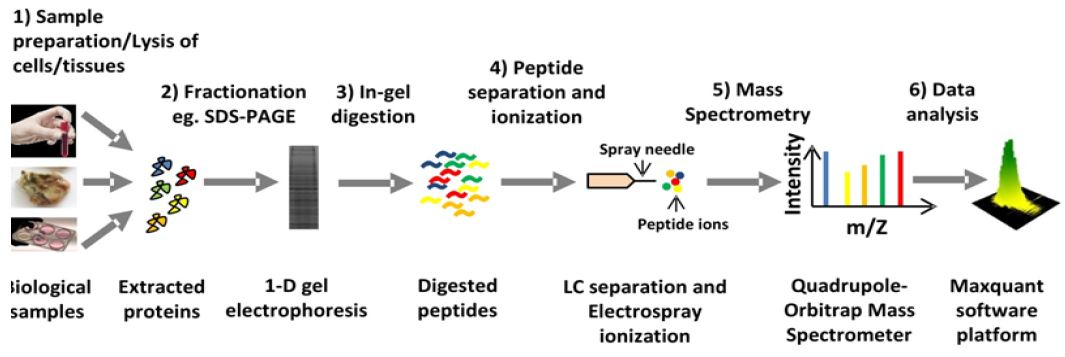
Figure 1: General overview of mass spectrometry-based proteomics workflow.
The advent of MALDI (matrix-assisted laser desorption/ ionization) and ESI (electrospray ionization) made it possible to use biomolecules such as peptides for mass spectrometric analysis. For these two methodic innovations the Nobel Prize in Chemistry was awarded in 2002. The combination of liquid chromatography (LC) with ESI and tandem MS (LC-MS/MS) is a highly efficient technique to deal with complex samples such as digested protein mixture obtained from a cell or tissue lysate. The general workflow of a typical mass spectrometry-based proteomics analysis is depicted in (Figure 1). The masses and the corresponding fragment ion spectra of the peptides are assigned to known protein sequences by searching a protein sequence database. Development of computational platforms such as Max Quant [2] along with the built in database search engine called Andromeda [3] has automatized protein identification and quantification by LC-MS/MS.
Complex protein extracts from cells, tissues and blood samples can now be routinely characterized using the LC-MS/MS technique identifying several thousand proteins within one LC-MS/MS run (Figure 1).
a. Diverse biological samples such as cells, tissues and blood samples can be analyzed. Samples are first lysed with an appropriate lysis buffer to extract the proteins.
b. The idea behind the fractionation of cellular lysate is to reduce complexity. Several ways of protein fractionation can be applied. The simplest way is to perform a 1D-gel electrophoresis.
c. After electrophoresis proteins are normally subjected to ingel digestion with a proteolytic enzyme such as trypsin.
d. Digested peptides are then eluted from the gel piece and then loaded into LC system coupled to a mass-spectrometer. Then peptides are separated in the reverse phase column of the LC and subsequently eluted and ionized with electrospray at the same time before get injected mass-spectrometer.
e. Precursor ions are detected and selected for fragmentation by tandem MS (MS/MS) in mass spectrometer.
f. Finally the data acquired by the mass-spectrometer is analyzed by an automated computational platform such as Max Quant.
Quantification of the proteome in multiple physiological states of a biological system provides meaningful information to better understand the biological phenotypes. However, quantification methods pose some technical challenges in proteomics. Broadly MS methods can be divided into two main categories for both relative and absolute quantifications of global proteome, namely: Labelbased and label free (Figure 2). The labels can be introduced at the protein or peptide level either metabolically or chemically.
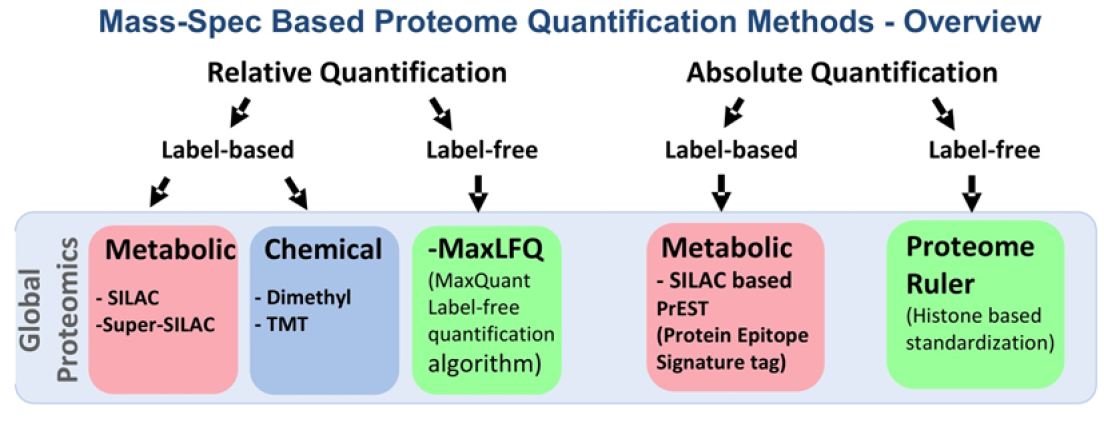
Figure 2: Mass Spectrometry-based quantitative proteomics methods.
Red box represent metabolic; Blue box represents chemical and Green box represents label-free methods of quantitative proteomics; SILAC: Stable Isotope Labeling of Amino Acids in Cell Culture; TMT: Tandem Mass Tag; MaxLFQ: Maxquant Label Free Quantification; PrEST: Protein Epitope Signature Tag
The major difference between metabolic and chemical labeling is that metabolic labeling is done at the protein level whereas chemical labeling is performed mostly at the peptide level after digestion. The strengths and limitations of different labeling methods are given in (Table 1). The tradeoff among metabolic labeling, chemical labeling and label-free quantifications is worth to consider when it comes to design quantitative mass spectrometric experiments to solve specific analytical questions.
Table 1: Overview of the strengths and limitations of most commonly used method for proteome quantifications.
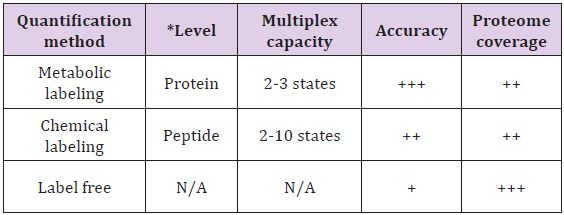
N/A: Not applicable; Adapted from Bantscheff et al. [4].
+ indicates the relative strength of the method,
+ indicates lower strength,
++ indicates medium strength,
+++ indicates higher strength.
*The level indicates the stage at which the samples are subjected to labeling.
Although transcriptomics studies are suitable for the identification of differentially regulated genes, the execution of cell fate decisions such as survival, proliferation and differentiation depends on the proteome. Since most of the biological processes are controlled by proteins, it is important to quantitatively measure proteome alteration in varying conditions to gain insights into mechanisms that regulate cellular processes. Although measurements of mRNA levels are frequently used as proxy for predicting protein abundance, it has been shown that mRNAs and their corresponding protein levels often are not directly correlated [4-6]. Many factors apart from mRNA abundance determine the levels and activities of proteins, including regulation of ubiquitinmediated protein degradation, differential translational rates and post-translational modifications 59. Therefore, investigation of the gene-specific protein-to-mRNA ratios in mammalian cells in a temporal manner is necessary to disentangle the dynamic interrelationship between transcriptome and proteome.


